Logging Summary
|
| IODP Expeditions 304-305: |
|
Oceanic Core Complex
Formation, Atlantis Massif
Expedition 304 and 305
Scientific Parties
|
| Introduction |
|
|
|
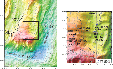
Figure
1. (a) Tectonic
and morphologic setting of
Atlantis Massif.(b) Basemap of
Atlantis Massif showing prior
geological and geophysical
data coverage and the location
of IODP drill sites
|
The principle objective of Expeditions
304 and 305 was to determine the
conditions under which oceanic core
complexes develop. A total of 3 sites
were drilled, two in the hanging wall
(U1310 and 1311) and one in the footwall
(U1309) of a major detachment fault
system. The deepest hole, Hole U1309D is
located on the central dome of Atlantis
Massif, 15 km west of the median valley
axis of the Mid-Atlantic Ridge, where
the seafloor coincides with a gently
sloping, corrugated detachment fault
surface (Figure
1).
Two drill holes at this site (U1309B
and U1309D) penetrate a
multiply-intruded crustal section.
During Expedition 304, Hole U1309B
(101.8 mbsf) was drilled and Hole U1309D
was spudded using a hammer drill with
casing, to provide stable reentry for a
deep hole. Hole U1309D was cored 401.3
mbsf with excellent recovery. During
Expedition 305, Hole U1309D was deepened
to a final depth of 1415 mbsf. It mainly
comprises gabbroic rocks ranging from
troctolite, olivine gabbro, gabbro and
gabbronorite to oxide gabbro. In
addition, several ultramafic intervals
were recovered in sections ranging from
1 to 20 m thick at various depths
between 60 mbsf and 1240 mbsf.
|
|
Logging
Operations
|
|
|
|
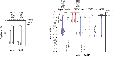
Figure 2.
Detail of the logging operations
in U1309B and U1309D. Red lines
indicate Expedition 304 runs,
blue and green lines Expedition
305 runs.
|
Wireline logging operations were
carried out in two boreholes (Figure 2).
Depths are shown in meters below
seafloor (mbsf). Although Hole U1309B is
of shallow depth it was logged (21.6 -
95 mbsf) to image the structural
variation. Hole U1309D was logged in
three separate stages (covering in total
54 - 1415 mbsf).
Hole U1309B (Expedition
304)
(1) The triple combo (HNGS [Hostile
Environmental Gamma Ray Sonde], APS
[Accelerator Porosity Sonde], HLDT
[Hostile Environmental Lithodensity
Sonde], DLL [Dual Laterolog], TAP
[Temperaturea/Acceleration/Pressure
tool]) tool string was lowered down to
94.9 mbsf without any problems. Two
complete passes were recorded from open
hole up to the seafloor. (2) The
FMS/Sonic (SGT [Scintillation Gamma Ray
tool], DSI [Dipole Sonic Imager], FMS
[Formation MicroScanner]) tool string
was lowered to 95.1 mbsf for two passes.
(3) A third run was devoted to the heave
compensator tuning with a short tool
string (GPIT [General Purpose
Inclinometry Tool], and DLL insulating
tube).
Hole U1309D
First stage, Interval 54-400
mbsf (Expedition 304)
(1) The triple combo (HNGS, APS, HLDT,
DLL) tool string was lowered to 400
mbsf. Tight spots were encountered at
74, 79, 96 mbsf during the first run. A
short repeat was made at the base of the
hole. The second tool string was the
FMS/Sonic. No problems were encountered
for reaching the bottom of the hole and
two logging passes were accomplished.
After a period when the Schlumberger
heave compensator was being tuned in the
open hole, the tool string became stuck
while entering the pipe and it took
approximately 30 minutes to get it free.
Any further attempts to log the hole
were cancelled.
Second stage
400-836 mbsf (Expedition 305)
A total of five tool strings were
successfully deployed to the bottom of
the hole at 836 mbsf The pipe was set at
170 mbsf to avoid an interval with bad
borehole conditions.
(1) Triple combo (HNGS, APS, HLDT, DLL,
TAP). Two passes were made and excellent
data recorded, covering the interval
between 836.5-170 mbsf. However, the TAP
failed and no data were recorded. (2)
FMS/Sonic (SGT, DSI, FMS). Two passes
were recorded with the first pass
covering the interval from 836.4 to 350
mbsf and the second pass logging the
entire open hole up to the pipe. (3)
SGT/UBI (Ultrasonic Borehole Imager). A
short first pass was completed from 824
to 724 mbsf to acquire high-resolution
images at a speed of 400ft/h. The tool
string was lowered again to make the
full main pass at normal speed (~800
ft/h) but no reasonable results were
acquired because the software could not
find a consistent signal to define the
travel time window. Consequently, only a
depth interval of particular interest
and good borehole conditions (between
700 and 500 mbsf) was logged at the slow
speed. (4) WST-3 (Well Seismic Tool,
three components) Following the IODP
marine mammal protocol, the WST-3 was
lowered. Nine stations obtained viable
interval velocities, seven of which were
in line with sonic velocities. The other
two stations were adjacent to each other
and one gave a high Interval velocity
(>7.5 km/s) and the other a somewhat
low value (5.0 km/s), relative to the
corresponding sonic measurement. (5)
Third-party magnetometer (GBM,
Goettingen Borehole Magnetometer). The
tool was initialized, taken to the rig
floor, connected to the wireline and
oriented along the ship-axes. Down- and
up-going passes were recorded in
real-time without problems.
Third stage
836-1414.5 mbsf (Expedition 305)
(1) Triple combo (HNGS, APS, HLDT, DLL,
TAP). The first pass covered the
interval from the bottom of the hole at
1415 mbsf to the pipe (194 mbsf). For
data quality check a short repeat pass
was run in an interval of low core
recovery (1270-1096 mbsf). (2) FMS/Sonic
(SGT, DSI, FMS). The FMS/sonic tool was
lowered to the bottom of the hole, but
telemetry problems with the lower part
of the tool were encountered. A broken
isolation joint between transmitter and
receiver section in the DSI was
identified when the tool string was
pulled back to the rig-floor, and the
DSI was subsequently removed. The
remaining SGT, GPIT, and FMS tools were
lowered back into the hole. A successful
first pass was recorded from TD to 734
mbsf and a second pass was run from TD
to 629 mbsf. (3) The WST-3 failed after
reaching the bottom of the hole and it
was replaced by the WST-1. During the
WST-1 descent, weather conditions
deteriorated and logging operations were
terminated. The third-party GBM
magnetometer tool was not deployed
because the borehole temperatures
(>80°C) were above the safe operating
range of the instument electronics.
Results
|
|
|
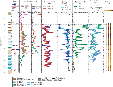
Figure 3. Results
of selected logging measurements
from Hole U1309B and their
correlation with discrete core
measurements.
|
|
|
| Figures
4a, b and c. Results of
selected logging measurements from
Hole U1309D.
|
|
|
| Figures 5.
Example of the excellent borehole
wall coverage by the FMS passes.
|
|
|
|
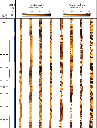
Figures 6.
Detailed FMS and UBI image
displaying A: the transition
from a patchy looking
coarse-grained olivine gabbro to
an olivine gabbro, and B: a
steep fracture indicated by low
resistivity (dark)
|
|
|
| Figures 7.
Detailed Formation MicroScanner
(FMS) image displaying an
oxide-rich layer (192-195 mbsf). |
|
|
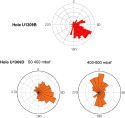
| Figures 8. Dips
measured in Holes U1309B and D
between 50 and 400 mbsf, and 400
to 830 mbsf. |
|
|
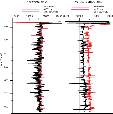
| Figures 9.
Comparison of GBM and GPIT
vertical components. |
|
|
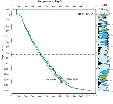
| Figures 10.
Temperature profile recorded by
the TAP tool while final stage
logging (Legend, see figure 4a). |
Overall, the logging data expand upon
core-basedobservations and provide in
situ measurements at Site 1301. The
triple combo was the only tool string
that provided reliable data of the
entire borehole revealing ideal places
for Packer experiments and allowing for
the interpretation of several logging
units that correlated to physical and
lithological changes identified from
core-based observations. The downhole
coverage obtained with the other tool
string deployments consisted of only 1/4
of the borehole’s total depth because of
a borehole obstruction. The VSP
experiment obtained the best results of
any subsequent tool deployment allowing
for the estimation of the shallow
basement velocity profile.
The logging data reflect the overall
variability of the drilled lithologies
comprising diverse kinds of gabbroic
rocks, diabase, and dunitic troctolites.
Figures 3 and 4 present the results of
selected logging measurements from Holes
U1309B and D. In the gabbroic rock
intervals, log bulk density varies
between 2.8 and 3.2 g/cm3, resistivity
ranges from 50 to 2000 Ohm.m. In
general, the PEF is below 4 barns/e- and
it averages around 3.1 barns/e-. The
compressional velocity log ranges
between 5.5 and 6.5 km/s. Most intervals
of oxide gabbro, as identified in the
visual core descriptions, can be
recognized in the logging data. They are
generally characterized by elevated
values of density (3.0-3.2 g/cm3), PEF
(4-8 barns/e-), Sigma (>30 cu) and
low electrical resistivity (<100
Ohm.m).
Logging data also reflect structural
changes and alteration modes. Structural
features like discrete, open faults and
fracture zones are portrayed by enlarged
borehole diameter (> 11 in), which
causes sudden apparent drops in density
(1.5-2 g/cm3), resistivity (10-50
Ohm.m), and velocity (4-5 km/s) and an
increase in neutron porosity. FMS images
show structural variations as well as
textural variations of gabbroic rocks.
In most intervals the coverage of the
borehole wall by the FMS is excellent
and is in limited intervals complemented
by the UBI images (Figures 2, 5). FMS
sections with patchy appearance
correspond to intervals of
coarse-grained gabbro (resistive
patches) (Figure
6) or oxide-rich gabbro
(conductive patches) (Figure 7).
There is not only a good correlation of
logging data with cataclasis and vein
occurrence but also with alteration
intensity. Alteration most strongly
affects the neutron porosity. Most
olivine-rich rocks, such as troctolite,
dunitic troctolite or olivine gabbro
show high levels of serpentinization and
they contain more structurally bound H2O
than olivine-poor gabbros. Based on this
relation, intervals with neutron
porosities of less than 5% as the least
altered gabbro. In concert with low
neutron porosity are high resistivities
(>500 Ohm.m). The dunitic troctolites
at 689-691, 1092-1170 and 1185-1195 mbsf
are highly altered and chemical analyses
on core samples indicate H2O contents of
around 8%. For these intervals, neutron
porosity is on average 20% and
electrical resistivity decreases to
below 100 Ohm.m. In Hole U1309B, within
the interval 57.6 to 61.5 mbsf, high
porosity values correspond to interval
where serpentinized peridotite was
recovered. High neutron porosity in this
particular interval could be explained
by the high content of bound water in
the serpentine minerals (10% H2O).
The continuous structural information
gained from the FMS images with respect
to dip and azimuth of conductive
fractures is a crucial contribution to
the understanding of the tectonic
evolution of the Atlantis Massif.
Structural analyses of FMS images
indicates a change in direction of the
dominant azimuth for conductive features
from the upper 400 m to the lower depth
interval between 400-800 mbsf (Figure 8).
The dominant azimuth changes from
preferentially southeast dipping
structures to a combination of north
dipping shallow structures and south
dipping steep structures.
Magnetic field intensity and direction
were recorded by the GBM and GPIT (Figure 9).
The vertical field component z shows a
high level of repeatability for the
downhole and uphole logs. In addition to
the GBM fluxgate sensors, the angular
rate of the GBM tool around the x, y,
and z spin axes was measured using three
fiber optic gyros. Rotation data will be
used for reorientation of the magnetic
data, the processing is still in
progress.
During the final logging run the
temperature of Hole U1309D was recorded
using the TAP tool. Log curves show a
slight change in the temperature
gradient below the 375 mbsf, at 720
mbsf, and 1100 mbsf (Figure 10).
These changes are recorded in each pass.
The depth intervals coincide with
changes in lithology (occurrence of
dunitic troctolites) or structural
features (fault zone). The maximum
recorded borehole temperature is 118.9°C
at 1415 mbsf; it is a minimum
temperature as the borehole fluid was
not in full equilibrium so shortly after
the drilling operation had finished.
|
Florence Einaudi: Logging Staff
Scientist, Expedition 304:, LGHF,
Université de Montpellier II, France
Heike Delius : Logging Staff
Scientist, Expedition 305:, Department
of Geology, University of Leicester,
United Kingdom
Margarete Linek: Logging
Trainee, Angewandte Geophysik
Rheinisch-Westfälischen Technischen
Hochschule, Aachen, Germany
|
|
|