Logging Summary
|
| IODP Expedition 318: |
|
Wilkes Land Glacial
History
Expedition 318
Scientific Party
|
| Introduction |
|
|
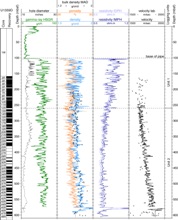
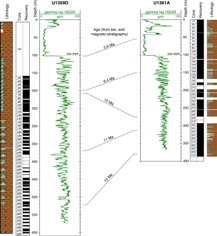
| Figure 1.
Downhole logs from Hole U1359D,
with logging units, described in
the text, given on the right side.
The core data have been shifted
down by about 5m to give a better
depth match to the log data (for
the cores, sea floor depth was not
determined, only estimated at this
hole) |
The overall aim of drilling the Wilkes
Land margin was to obtain a long-term
record of Antarctic glaciation and
discover its relationships with global
paleoclimatic and paleoceanographic
changes. In particular, the expedition
investigated the sensitivity of the East
Antarctic Ice Sheet to climate at times
when the Earth was warmer than is today.
Critical periods in Earth's climate
history were examined: the
Eocene-Oligocene and Oligocene-Miocene
transitions, the mid/late Miocene,
Pliocene, and the last deglaciation.
During this time, the Antarctic
cryosphere evolved in a step-wise
fashion to ultimately assume its
present-day configuration, characterized
by a relatively stable East Antarctic
Ice Sheet.
Downhole logging results characterized
in situ formation properties and
established the links between core, log,
and seismic data. They addressed two of
the expedition's four objectives:
- Objective 2: Fluctuations in the
glacial regime during the Miocene (?)
and transition from wet-based to
cold-based glacier regimes (Late
Miocene-Pliocene?).
- Objective 3: Distal record of
climate variability during the late
Neogene and the Quaternary.
Two of the seven sites drilled during
Expedition 318 were logged (Holes U1359D
and U1361A). Of the other sites, two had
to be abandoned before logging due to
storms and high seas (Hole U1356A and
Hole U1357C), and three did not
penetrate deep enough to be logged (each
less than 71 m).
The two logged sites are located on
channel levees on the continental rise,
and are separated by ~50 km. The
downhole logs cover the time interval
from 3.6 to 12.5 Ma, and have
high-amplitude 1 to 5-m-scale
lithological variability superimposed on
a downhole compaction trend (Figure 1
& Figure 2).
A complete overview of the expedition
results and preliminary conclusions is
available in the
Expedition 318 Preliminary Report.
|
|
Logging
Operations
|
|
|
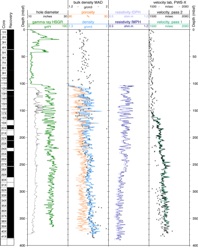
| Figure 2. Downhole
logs from Hole U1361A. Bulk
density from moisture and density
core measurements and sonic
velocity from the X-direction
caliper are also shown for
comparison. |
Standard downhole logging tool strings
were deployed in Holes U1359D and
U1361A: the triple combo (comprising
resistivity, density, porosity and
natural gamma radiation tools), and the
FMS-Sonic (comprising the FMS
micro-resistivity imager, sonic, and
natural gamma radiation tools). The
holes were filled with heavy mud prior
to logging (weight 10.5 ppg, including
attapulgite and barite). The bottom of
the hole was reached in both cases,
indicating stable borehole conditions
with little in-fill.
The VSI tool string (geophone and
natural gamma radiation tools) was
deployed in Hole U1359D only. Checkshot
stations at 25 m intervals were planned,
but after the tool reached the bottom of
the hole the caliper arm would not open
to clamp the VSI's geophone against the
borehole wall. However, with the tool
resting on the infill at the bottom of
the hole at 601.5 mbsf (WSF), it was
possible to get four reliable waveforms
that were stacked to yield a one-way
travel time of 2.3867 seconds.
Table: Expedition 318
logging operations summary
|
Hole
|
Date logged
|
Water
depth
(m, WSF)
|
Max
depth
(m, WMSF)
|
Pipe
depth
(m, DSF)
|
Tools run
|
|
U1359D
|
Feb 23-24, 2010
|
3019.5
|
606
|
97
|
Triple Combo, FMS-Sonic, VSI
|
|
U1361A
|
Mar 1 2010
|
3469.5
|
390
|
103
|
Triple Combo, FMS-Sonic
|
Scientific
Highlights from Downhole Logging
|
|
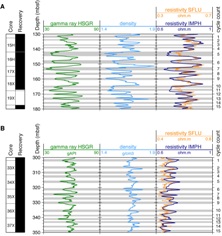
Figure 3.
Comparison of downhole logs near
the top (A, 130-180 mbsf, ~5.5-7.5
Ma) and bottom (B, 300-350 mbsf,
~10.5-11.5 Ma) of the logged
interval at U1361A, showing
correlation between gamma
radiation and resistivity logs in
A. and anti-correlation in B. Grey
bars mark low natural gamma
values, thought to be caused by
microfossil-rich sediment layers.
A consecutive count of these
layers is given on the right of
the image, giving an estimate for
the average duration of the
alternations in the 60-150 kyr
range.
|
Identification of lithology
from the logs
Downhole logs, particularly natural
gamma radiation (NGR) and density,
provide an overview of lithological
stratigraphy at quite high resolution
(~30cm). The NGR signal at the two
logged sites is dominated by the
radioactivity of potassium and thorium.
Both of these elements are found in clay
minerals, and the sediments at Sites
U1359 and U1361 are clay-rich, so to
first order the NGR signal is probably
tracking clay content. Minerals like
potassium feldspar and biotite will also
contribute to the NGR signal.
Intervals of low NGR values correspond
to diatom-rich layers in the core,
because diatoms are not radioactive and
they dilute the NGR signal from K, Th,
and U in the clays and terrigenous
minerals that make up the balance of the
sediment. The NGR logs promise to be a
useful method for identifying
diatom-rich and diatom-bearing zones in
the core (where they are not always
apparent to the eye), and complete the
stratigraphy in unrecovered intervals
(e.g. Hole 1361A, shown in Figure 3).
The density log also helps to identify
diatom-rich zones (Figure 3).
Relatively low density values result
from the intra-granular porosity
contained in the diatom shells and the
low grain density of the opal that forms
the diatom shells (2.1-2.2 g/cm3
compared to 2.6-2.75 g/cm3 for the other
major sedimentary minerals). Shallower
than 350 mbsf (~11.5 Ma), the
resistivity and sonic velocity logs
follow the pattern of the natural gamma
and density logs, because the higher
porosity in the diatom-rich intervals
leads to low resistivity and low
velocity. However, deeper than 350 mbsf,
the opposite relation holds: low natural
gamma values often correspond to higher
resistivity (Figure
3). One possible explanation is
that the diatom (and nannofossil)-rich
intervals are more easily cemented than
the clay-rich sediments that enclose
them.
Cyclicity
Figure 3
also illustrates the cyclic nature of
the sediment sequence at Site 1361,
which alternates between high and low
log values (diatom-rich and diatom-poor
lithologies) at intervals of 1 to 5 m.
As a first rough estimate of the average
duration of these alternations, the
number of cycles in both of the
intervals shown in Figure 3 was
counted. For the 130 to 180 mbsf
interval (~5.5 - 7.5 Ma), there are
about 15 alternations and therefore the
average duration is approximately 133
kyr for each cycle, which seems to be in
the ballpark of the orbital eccentricity
Milankovitch periodicities (96 and 125
kyr). The 300 to 350 mbsf interval
(~10.5 - 11.5 Ma) also contains about 15
alternations, giving an average duration
of approximately 67 kyr for each cycle.
Given the uncertainties in the initial
age estimates, the probability that all
cycles are not recorded equally well in
the sediment record, the possibility of
multiple cyclicities influencing the
sediment record, and the subjective
nature of counting cycles, this early
estimate requires further verification.
But it seems possible that Milankovitch
band variability at eccentricity and
maybe obliquity periods influences
sedimentation at Site U1361.
|
|
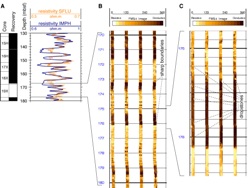
Figure 4. Examples
of resistivity logs and FMS
resistivity images from Hole
U1361A. A, resistivity logs, 130
to 180 mbsf; B, FMS image showing
conductive (dark) and resistive
(light) layers; C, a single
conductive layer containing
dropstones (light colored spots).
|
Identification of beds and
dropstones in FMS resistivity images
FMS resistivity images reveal
stratigraphic information at a finer
spatial resolution than the standard
resistivity logs, including both gradual
and sharp transitions between the
alternations of resistive and conductive
beds, and dropstones and IRD larger than
about 0.5 cm (Figure
4). The dropstones, indicative of
ice-rafting, appear as resistive
(light-colored) spots in the image, and
it will be possible to map their
occurrence downhole.
|
|
Figure 5. Comparison
of Sites U1359 and U1361. The
intervals 4.2-6.4 Ma and 10-12 Ma
are covered in the logs at both
sites, permitting stratigraphic
correlation. The lithological
columns are from the shipboard
site reports (green = diatoms,
brown = clays and silty clays). .
|
|
|
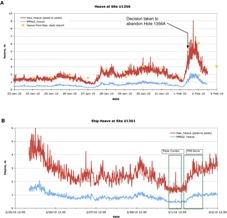
Figure 6. Ship
heave over the course of
operations at A. Hole U1356A, and
B. U1361A. Heave is determined
from acceleration measurements of
the motion reference unit located
near the center of the ship. Heave
became too high for logging (or
drilling) at U1356A, and during
the FMS-Sonic deployment at
U1361A, high heave made bringing
the tools up through the pipe to
the ship a very slow process.
|
Stratigraphic correlation
between Sites U1359 and U1361
Sites U1359 and U1361 should contain
similar stratigraphic sequences, as they
are both governed by similar climatic
and paleoceanographic changes, are both
on the same channel levee, and are
separated by only 50 km. However, Site
U1361 is further down the slope from
U1359, and one site may be by-passed by
sediments that are deposited at the
other. This is evident in Figure 5,
showing that the 6.4-10 Ma interval is
represented at U1361, but is highly
condensed at Site U1359.
Ship heave and downhole logging
Ship heave (the periodic vertical
motion of the ship) is a critical factor
that determines the quality of the log
data and the safety of the tool strings.
Heave was determined from acceleration
measurements of the motion reference
unit (MRU), located near the center of
the ship, and was monitored throughout
drilling and logging operations (Figure 6).
Such plots help to understand how
quickly heave conditions can change, and
at what level the ship's motion becomes
a problem to the log quality or the
logging operation.
|
Trevor Williams:
Logging Staff Scientist, Borehole
Research Group Lamont-Doherty Earth
Observatory of Columbia University, PO
Box 1000, 61 Route 9W, Palisades, NY
10964, USA
Annick Fehr: Logging
Staff Scientist, Institute for Applied
Geophysics and Geothermal Energy, E.ON
ERC, RWTH Aachen University, Mathieu
Str. 10, D-52074 Aachen, Germany
|
|
|