Logging Summary
|
IODP Expedition 320-321:
|
Pacific Equatorial Age
Transect (PEAT)
Expedition 320-321
Scientific Party
|
| Introduction |
|
|
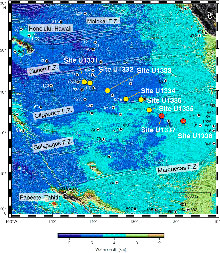
| Figure
1. Map showing the
location of sites drilled during
Expeditions 320-321. |
The Pacific Equatorial Age Transect, or
PEAT, program (IODP Expeditions 320/321)
was designed to recover a continuous
sedimentary record of the Cenozoic by
drilling a transect at the paleoposition
of the equator at successive crustal
ages. The sites were located to maximize
the recovery of well-preserved
carbonate-rich sediments (Figure 1).
The first expedition of the PEAT program
(Exp. 320) obtained records from six
sites (U1331-U1336) spanning the
Paleogene, while the two sites drilled
in Exp. 321 (U1337 and U1338) were
focused on the Neogene time
interval. The key objectives of the
PEAT program were to reconstruct the
Cenozoic history of changes in the
calcium carbonate compensation depth and
paleoproductivity in the equatorial
Pacific; to calibrate the Cenozoic
geological timescale using orbitally
forced variations in sediment
composition; to determine ocean
paleotemperatures and nutrient profiles;
to better constrain Pacific plate
tectonic motion and better locate the
Cenozoic equatorial region in plate
reconstructions; and to correlate
sedimentary sections with existing
seismic stratigraphy to develop an
improved model of sedimentation in the
equatorial Pacific.
The primary logging objectives of
Expeditions 320-321 were to collect
high-resolution downhole physical
property data and integrate them with
core measurements.
Wireline logging was planned for the
first hole at all sites. The purpose of
this was to provide near real-time
information about the sediment column to
guide drilling operations in subsequent
holes and maximize recovery.
Downhole measurements of natural
gamma-ray radioactivity, bulk density,
electrical resistivity, and elastic wave
velocity were taken to complement the
physical property measurements made on
cores and to assist in establishing a
detailed lithostratigraphy at each site.
In particular, downhole measurements
were helpful in reconstructing the
lithostratigraphy in intervals that
contained chert and porcellanite and had
incomplete core recovery. The logging
program also included vertical seismic
profile (VSP) operations at both
sites. The VSP “checkshot” data
(measurements of the arrival time of
seismic pulses generated at the sea
surface) gave a relationship between
depth in the borehole and travel time in
seismic sections. This travel
time-depth relationship will be a
critical input to the seismic
stratigraphy study that is one of the
PEAT objectives.
|
|
Logging
Operations Summary
|
|
|
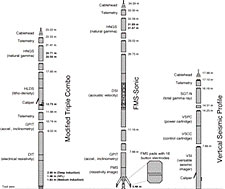
| Figure 2.
Tool strings used during IODP
Expeditions 320 and 321.
The "modified Triple Combo"
configuration shown is that used
in Exp. 321; in Exp.320, the DIT
tool was replaced by the Magnetic
Susceptibility Sonde (MSS). |
The planned logging program included
two logging runs at each site: a
modified Triple Combo tool string
(natural gamma-ray, density, and
resistivity or magnetic susceptibility)
and the Formation Microscanner
(FMS)-Sonic tool string. The Versatile
Seismic Imager (VSI) was deployed on two
sites during Expedition 321 (Figure
2).
The FMS tool obtains high-resolution
(~1 cm) resistivity images with arrays
of electrodes on four pads that are
pressed against the borehole wall. Two
overlapping passes of the Triple Combo
and of the sonic-FMS tool string were
attempted in each hole; the measurements
were generally repeatable and of high
quality.
The Triple Combo takes a measurement of
the borehole diameter and was always run
first to assess the hole quality for
subsequent operations. The order of the
sonic-FMS and VSI runs was determined by
the need to shoot the VSP airgun source
during daylight hours. Daytime shooting
was required to maintain a marine mammal
watch.
Two sites (U1331, U1332) were logged as
part of Expedition 320 and two (U1337,
U1338) were logged during Expedition
321.
The deployment of two tool strings was
planned for Hole 1331A: the modified
Triple Combo with density, natural gamma
and magnetic susceptibility tools and
the Formation Micro Scanner (FMS)–Sonic
string. However, when the new Active
Wireline Heave Compensation System was
turned on, once the modified Triple
Combo reached the base of pipe, it
failed to work. Given the relatively
calm sea state we proceeded to run
without active heave compensation. The
hole was logged down with the modified
Triple Combo to the base reaching total
depth at 190.6 m WSF. During the uplog
it became apparent that the wireline
winch unit was experiencing problems and
we had some difficulty in retrieving the
tool string. Due to these problems the
deployment of the FMS-Sonic tool string
was abandoned.
Two deployments were planned for Hole
U1332A: the modified Triple Combo and
the FMS-Sonic string. The modified
Triple Combo tool string was lowered and
logged down to ~150 m WSF, almost to the
bottom of the hole. Two upward logging
passes were made up to the base of the
pipe. The tools provided continuous and
good quality log data, but they are
affected by ship heave (typically 2m
peak to peak), because the wireline
heave compensator (WHC) was not working.
At the end of the second upward pass at
Hole U1332A we encountered difficulties
when attempting to pull the tool string
back into the pipe. During this
procedure, communications with the tool
string were lost, and shortly after that
the wireline lost ~800 lbs of weight,
corresponding to the weight of the tool
string. When the wireline was retrieved
it was confirmed that the tool string
was severed from the wireline. Fishing
attempts to retrieve the tool string
were unsuccessful and Hole U1332A was
cemented and abandoned.
At Site U1334, while the tool string
(DSI/DIT) was being lowered through the
pipe about 1700m below the ship, the
transmission on the wireline winch
failed, and the tool string had to be
retrieved using the coring winch. No
further logging operations were possible
during the expedition.
|
|
Logging
Results
|
We present here a summary of the
logging data and some highlights of the
results. Because of hole instability in
the shallow sediments, the base of the
drill pipe was lowered to 70-80 m below
the sea floor during logging, and
wireline logs were generally not
recorded in this interval. The exception
was the natural gamma-ray log: although
the measurement of natural radioactivity
was attenuated by the drill pipe, the
gamma-ray log was recorded to detect the
depth of the seafloor and obtain a
wireline depth scale below sea floor
(WSF). In the Expedition 320 and 321
sites, the sea floor was clearly marked
by a peak in natural radioactivity due
to a relatively high uranium content.
After data acquisition, the measurement
depths were adjusted to match across
different logging runs, obtaining a
wireline depth scale matched below
seafloor (WMSF).
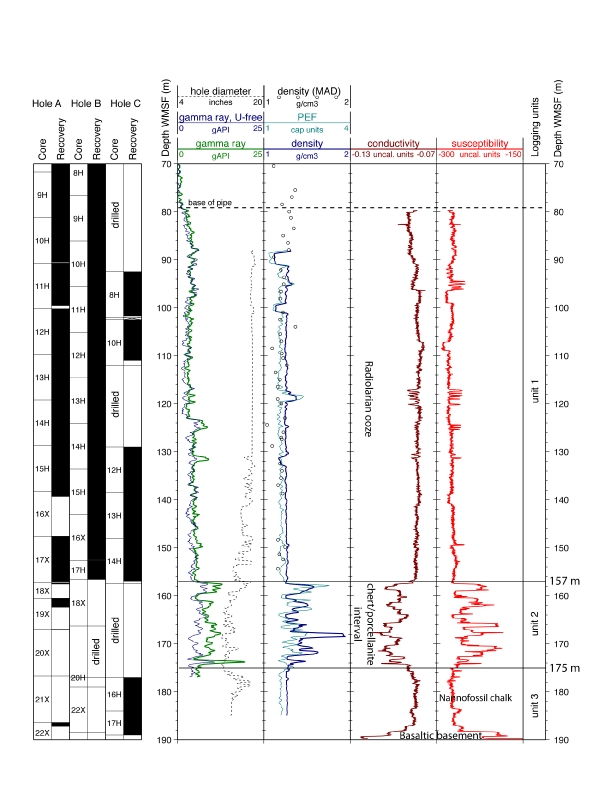
Hole U1331A
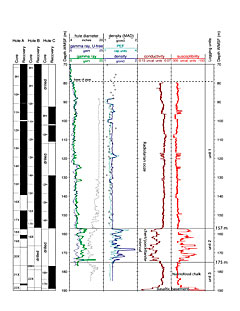 |
| Figure 3.
Summary of downhole log
measurements in Hole U1331A. |
The successful deployment of the
modified Triple Combo tool string at
U1331A provided complete coverage of the
~190 meter open hole interval with good
physical property and lithologic
information for density, natural gamma
ray, photoelectric effect, conductivity
and magnetic susceptibility (Figure 3).
The downhole logs provided important
information about the interval between
157 m and 175 m WMSF which consisted of
interbedded cherts and porcellanites
with very little core recovery.
 |
| Figure
4. Summary of
downhole log measurements in
Hole U1332A. |
The modified Triple Combo tool string
once again provided complete coverage of
the open hole section at Hole U1332A.
Good physical property and lithologic
information was obtained for the ~150
meter section including density, natural
gamma ray, photoelectric effect,
conductivity and magnetic susceptibility
(Figure
4). The interval between 136-146 m
WMSF was characterized by a series of
peaks in density. The
corresponding lithostratigraphy,
although only partially recovered in
this interval, is a mixture of
radiolarian oozes and porcellanites.
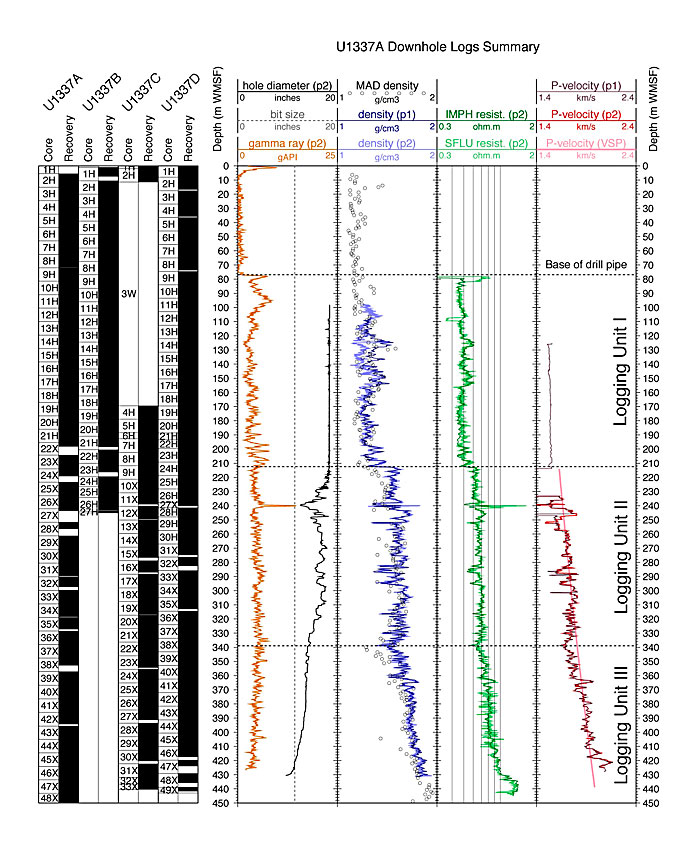
Hole U1337A
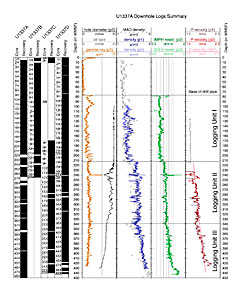 |
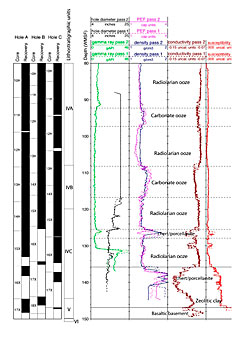
| Figure 5
. Summary of
downhole log measurements in
Hole U1337A. |
Site U1337 was targeted to recover the
early middle Miocene interval on ~24 Ma
crust, and the column drilled at Site
U1337 represents a nearly complete and
continuous Neogene sedimentary
section. A summary of the downhole
log measurements taken in Hole U1337A is
in Figure
5. Three logging units were
identified: Unit I (77-212 m WMSF) and
Unit II (212-339 m WMSF) have average
densities of ~1.3 and ~1.6 g/cm3,
respectively, that do not show any trend
with depth, whereas in Unit III (339-442
m WMSF) density increases with depth
reaching 1.85 g/cm3 at the
base of the hole. Resistivity and P-wave
velocity follow a pattern similar to
that of density, suggesting that the
major control on these physical
properties are variations in sediment
composition that give rise to
corresponding variations of
porosity. Changes in porosity
affect similarly these logged
properties, with high-porosity sediments
having low bulk density, low
resistivity, and low P-wave velocity.
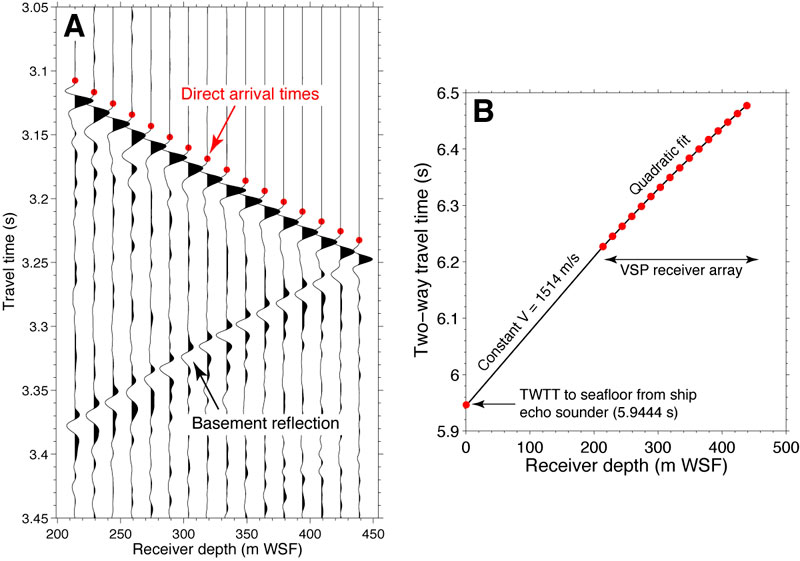
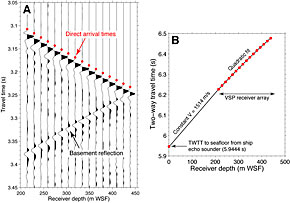 |
| Figure 6
. VSP data in Hole
U1337A. |
Natural gamma ray measurements were low
throughout the logged interval (~5
gAPI), except for two pronounced peaks
caused by uranium, one at the seafloor
and the other at 240 m WMSF. The gamma
ray peak at 240 m WMSF corresponds to a
~40 cm thick chert layer that has only
been recovered as rubble in the cores
but can be clearly identified in the
downhole logs and borehole images as an
interval of high density and
resistivity.
A VSP experiment was also performed in
Hole U1337A, and the arrival times of
the seismic pulse from the sea surface
were measured at 16 stations in the
214-439 m WSF depth interval (Figure 6).
Together with the travel time to the
seafloor, VSP measurements are the basis
for a travel time-depth conversion that
allows seismic reflectors to be
correlated to stratigraphic events.
Finally, downhole temperature
measurements and thermal conductivities
of core samples were combined to
estimate a geothermal gradient of
32.4°C/km and a heat flow of 28.4 mW/m2
at Site U1337.
Hole U1338B
|
|
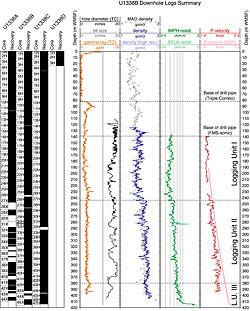
| Figure
7. Summary of
downhole log measurements in
Hole U1338B. |
Site U1338 was planned to collect a
3-18 Ma sediment interval, and the
drilled sediment column is a nearly
complete and continuous early Miocene to
Holocene section. The log
measurements taken in Hole U1338B are
summarized in Figure
7. Downhole log data were used to
define three logging units: Unit I
(139-244 m WMSF) and Unit II (244-380 m
WMSF) have average densities of ~1.45
and ~1.6 g/cm3, respectively,
that do not show any trend with depth,
whereas in Unit III (from 380 m WMSF)
density increases with depth, reaching
1.7 g/cm3 at the base of the
hole. Resistivity and P-wave velocity
follow a pattern similar to that of
density throughout the logged interval,
suggesting that the major control on
these physical properties are variations
in sediment porosity. Both resistivity
and density measurements show a
small-scale peak at 280 m WMSF. This
peak is clearly visible in the borehole
resistivity images as a high-resistivity
layer 16 cm thick, and it corresponds to
a chert layer that has only been
recovered as rubble in the cores.
Natural gamma ray measurements are low
throughout (~4 gAPI) but do show a
pronounced high at the seafloor caused
by a local increase in uranium
concentration.
In the Hole U1338B VSP experiment, the
arrival time of a seismic pulse from the
sea surface was measured at 14 stations
in the 189.5-414.5 m WSF depth interval.
As at Site U1337, these arrival times
are the basis for correlation of
stratigraphic events to seismic
reflectors. Downhole temperature
measurements and thermal conductivities
of core samples were combined to
estimate a geothermal gradient of
34.4°C/km and a heat flow of 33.6 mW/m2
at Site U1338.
|
|
Scientific
Highlights
|
Lithostratigraphic Correlation
 |
|
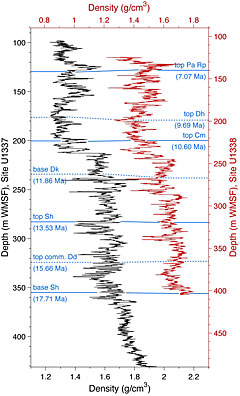
Figure
8. High-resolution
bulk density downhole logs from
Holes U1337A (black) and U1338B
(red) with depth scales shifted
and stretched to match the
different sedimentation rates at
the two sites.
|
Previous drilling showed that sediment
properties in coeval equatorial Pacific
sequences are highly correlated between
sites separated by large
distances. Figure 8
compares the downhole density logs
measured in Sites U1337 and U1338, which
are ~600 km apart. The depth scales in
the two holes have been shifted and
stretched to account for the different
overall sedimentation rates at the two
sites, and the depths of several
nannofossil events from the shipboard
stratigraphy are shown for comparison.
The continuous density log curves are
ideal to establish a lithostratigraphic
correlation between the two sites.he
successful deployment of the modified
Triple Combo tool string at U1331A
provided complete coverage of the ~190
meter open hole interval with good
physical property and lithologic
information for density, natural gamma
ray, photoelectric effect, conductivity
and magnetic susceptibility (Figure
3). The downhole logs provided
important information about the interval
between 157 m and 175 m WMSF which
consisted of interbedded cherts and
porcellanites with very little core
recovery.
The downhole log depth scale, however,
has been established independently from
the core depth scale, and the depths of
stratigraphic events observed in the
cores do not exactly correspond to
depths in the log. To address this
issue, post-cruise work will concentrate
on developing an accurate core-log depth
correlation by comparing composite
density curves measured on cores with
the density logs. Once this correlation
is established, the downhole log data
can be plotted in the composite depth
scale and can be used to aid the
detailed correlation of stratigraphic
events from the core data.
In addition, the interval 260-360 m
WMSF in the Hole U1337A density and
resistivity logs shows prominent
sediment cycles. This interval should
correspond to ~13-19 Ma, a time interval
of broad interest that encompasses the
end of the mid-Miocene climatic optimum
and the subsequent cooling that led to
the formation of a stable East Antarctic
ice sheet. The geological time
scale is not well constrained in this
interval, and during post-cruise
research downhole log data will be
correlated to an astronomical tuning
curve to derive an age model. By
establishing an accurate core-depth
correlation (see above), this age model
will be able to date key stratigraphic
events (e.g., ages of geomagnetic
polarity reversals).
Cherts and Porcellanite
Layers
Intervals of chert/porcellanite
occurred in both Sites U1331 and U1332.
Only small amounts of these lithologies
were recovered at both sites. In Hole
U1331A downhole logs show ~18 meters of
interbedded chert/porcellanite and
radiolarian oozes (Figure
2). The chert layers show higher
density, gamma ray and photo-electric
factor values than the surrounding
sediment. Of particular interest is the
increased magnetic susceptibility and
low conductivity in the
chert/porcellanite layers. The depth of
the chert-rich interval was identified
in the logs (157-175 m WSF), which
allowed the coring strategy in Holes
U1331B and U1331C to be adjusted to
maximize recovery of the target sediment
interval beneath the chert.
In the Hole U1338B VSP experiment, the
arrival time of a seismic pulse from the
sea surface was measured at 14 stations
in the 189.5-414.5 m WSF depth interval.
As at Site U1337, these arrival times
are the basis for correlation of
stratigraphic events to seismic
reflectors. Downhole temperature
measurements and thermal conductivities
of core samples were combined to
estimate a geothermal gradient of
34.4°C/km and a heat flow of 33.6 mW/m2
at Site U1338.
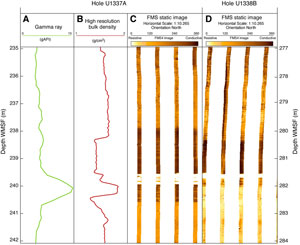 |
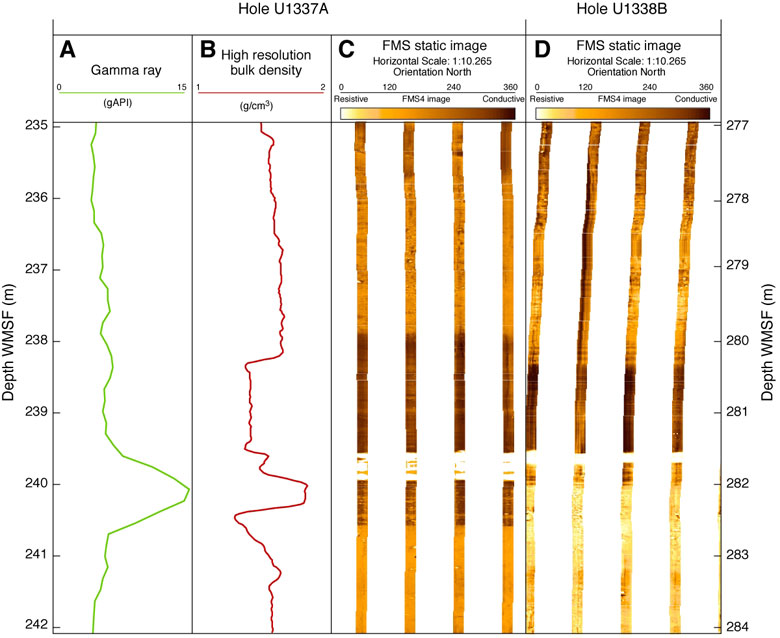
| Figure
9. Downhole logs
in the interval containing a thin
chert layer, Holes U1337A and
U1338B. |
Figure
9 compares the Formation
MicroScanner (FMS) images measured at
Sites U1337 and U1338 in the respective
intervals that contain a thin chert
layer. The images show high
resistivities in light shades and low
resistivities in dark shades. The chert
layer shows up as a thin high
resistivity layer (40 cm at Site U1337
and 16 cm at Site U1338) sandwiched
between two low resistivity beds that
are diatom-rich oozes. The intermediate
resistivity intervals above and below
the diatom-rich beds are carbonate
oozes. The preliminary shipboard
stratigraphy suggests that these thin
chert layers may be coeval (~12 Ma,
upper middle Miocene). Core recovery was
poor around the chert intervals, and
chert samples were only retrieved as
rubble. Nonetheless, a comparison
of core images with the FMS logs showed
that there was only a small amount of
disturbed and missing section (<1 m)
in the sediments cored around the
chert.odified Triple Combo tool string
once again provided complete coverage of
the open hole section at Hole U1332A.
Good physical property and lithologic
information was obtained for the ~150
meter section including density, natural
gamma ray, photoelectric effect,
conductivity and magnetic susceptibility
(Figure
4). The interval between 136-146 m
WMSF was characterized by a series of
peaks in density. The
corresponding lithostratigraphy,
although only partially recovered in
this interval, is a mixture of
radiolarian oozes and porcellanites.
Seismic Stratigraphy
Correlation and Synthetic
Seismograms
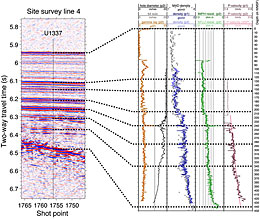 |
| Figure
10. Correlation
between the seismic reflection
record at Site U1337 (line 4 of
the AMAT-03 site survey in the
PEAT-7 area) and depth in Hole
U1337A. |
Figure
10 shows an initial correlation
between depth in Site U1337 and seismic
reflectors in a site survey profile.
This correlation is based on the first
arrival travel times measured in the VSP
at Site U1337 (Figure
6). In reflection surveys,
seismic waves are reflected at
interfaces where there is a contrast in
density and P-wave velocity. The
downhole logs in Figure 10 confirm that
heterogeneities in density and velocity
give rise to seismic reflectors. During
post-cruise research, the initial travel
time-depth correlation of Figure 10 will
be refined and extended to other sites.
The goal is to calibrate the seismic
stratigraphy and better constrain
reconstructions of the sedimentation
history in the Pacific equatorial
region.
 |
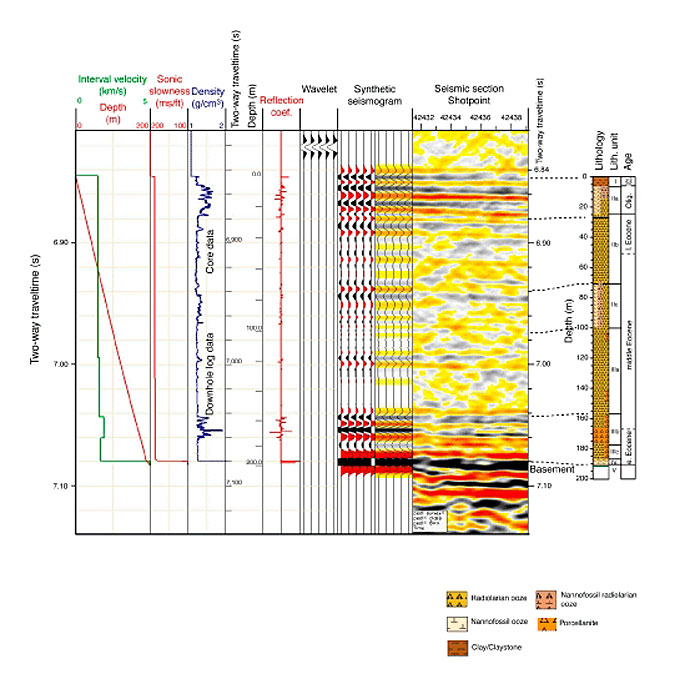
| Figure
11. Synthetic
seismogram for Hole U1331A |
Synthetic seismograms were made from
bulk density and sonic velocity data
from core material and downhole logs
using the IESX software by Schlumberger
GeoQuest. The synthetic seismogram was
stretched and squeezed slightly to line
up the synthetic reflections with those
in the seismic section. Typically, only
a small number of adjustments were
needed to give a good match. The
synthetics help to match features in the
lithology to reflections in the seismic
section. An example from Site U1331 is
given in Figure
11.
Summary
A downhole logging
program was successfully carried out
on IODP Expedition 321. Downhole logs measured
profiles of natural gamma-ray
radioactivity, density, electrical
resistivity, and velocity together
with high-resolution electrical
resistivity images of the borehole
wall. VSP
experiments were also run at both Exp.
321 sites. The downhole
measurements have been useful in
reconstructing the drilled sequence in
intervals of difficult core recovery,
and will help to address some of the
major objectives of the PEAT program.
Post-cruise
activities will concentrate on
developing an accurate core-log depth
correlation.
|
Helen Evans: Logging
Staff Scientist, Borehole Research
Group, Lamont-Doherty Earth Observatory
of Columbia University, PO Box 1000, 61
Route 9W, Palisades, NY 10964, USA
Trevor Williams:
Logging Staff Scientist, Borehole
Research Group, Lamont-Doherty Earth
Observatory of Columbia University, PO
Box 1000, 61 Route 9W, Palisades, NY
10964, USA
Alberto Malinverno:
Principal Scientist, Borehole Research
Group, Lamont-Doherty Earth Observatory
of Columbia University, PO Box 1000, 61
Route 9W, Palisades, NY 10964, USA
Louise Anderson:
Logging Staff Scientist, Department of
Geology, University of Leicester,
Leicester LE1 7RH, United Kingdom
|
|
|