The 9.875 inch open hole section was
drilled to 528 mbsf and cleaned with a
succession of wiper trips. The hole was
not displaced to mud. The drillstring
was pulled to surface and made up with a
new packer BHA before being run back
inside the 10.75 inch casing. The
wireline toolstring was then run out of
the BHA into casing where the wireline
heave compensator (WHC) was started.
Surface heave was ~0.9 m pk-pk and the
downhole motion (~180% of surface
motion) didn't diminish once the WHC was
started. The wireline string was then
run to bottom while borehole fluid
acoustic velocity and temperature were
being logged.
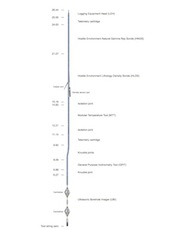
Three logging passes were made at
varying speeds using different UBI
settings. The first was run at 600 ft/hr
using conservative UBI settings in an
attempt to acquire usable data over as
much of the open hole as possible (hole
ID of less than 13 inches was expected
over only a few intervals). The second
pass was logged using higher-resolution
UBI settings at 400 ft/hr over the best
hole sections and at 800 ft/hr over the
larger hole interval. The third pass was
conducted with the highest-resolution
UBI settings at 400 ft/hr through the
good interval, then 2000 ft/hr
thereafter.
A fourth pass was conducted to
investigate a possible tight hole
interval. Just before starting the pass,
the toolstring was lowered, damaging the
extended HLDS caliper extended: the
caliper could no longer be closed with
surface commands though it continued to
read hole diameter. Because of the
damaged caliper, the planned WHC testing
period was cancelled and the toolstring
and was pulled to surface to complete
logging operations.
The ultrasonic radial measurements
confirmed the intervals identified with
the mechanical caliper. However, the
ultrasonic caliper was highly erratic
and noisy, owing perhaps to the high
degree of downhole tool motion. Where
the ultrasonic caliper values appear
meaningful, they indicate a nearly
circular borehole through the near-gauge
sections. The major axis, which
represents the direction minimum
horizontal stress, lies roughly
north-south.
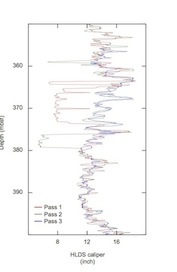
While the HLDS caliper was generally
highly repeatable, a notable anomaly was
observed during the first pass: an
apparently undergauge 7.7 inch OD
interval at 363.5 mbsf (Figure 3).
On the second pass, the apparent tight
interval had reduced to only 5.5 inch OD
and was observed at 376 mbsf. Two new
caliper spikes were observed at 359 and
413 mbsf. The third and fourth passes of
the HLDS caliper observed no undergauge
intervals, nor did the ultrasonic
caliper. It's possible that the apparent
tight interval represent sloughed
material falling down the borehole, or
that debris was somehow affecting the
mechanical caliper arm.
Natural Gamma Ray
|
|
Figure 4.
Total gamma ray in the
9-7/8 inch section of Hole U1362A
is strongly influenced by
potassium content.. .
|
|
|
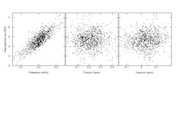
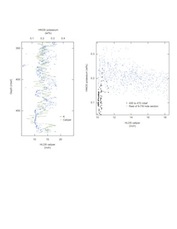
Figure 5.
1. HLDS caliper and HNGS potassium
content vs depth in Hole U1362A.
2.HLDS caliper and HNGS potassium
content correlate poorly over the
length of the 9-7/8 inch section,
except for the interval from 455
to 470 mbsf.
|
Gamma ray measurements repeat well
overthe three passes. In the open hole,
total gamma ray values are low (2.1 to
7.4 API, typical of basaltic oceanic
crust) and are driven by potassium
content (Figure
4).
In a few intervals, like the one
starting at 470 mbsf, an increase in
gamma ray values corresponds with an
increase in borehole size; intervals
like these can represent weaker,
fractured zones of greater alteration
and may be indicative of focused
hydrothermal fluid flow.
Correspondingly, the intact, in-gauge
interval at 455 mbsf has low gamma ray
values. Over most of the open hole
section, however, HNGS potassium and
HLDS caliper correlate inversely (Figure 5).
The apparent reduction in HNGS potassium
concentration may be due to insufficient
correction for borehole size during
processing.
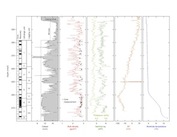
A pronounced increase in HNGS gamma ray
values is observed at the casing shoe (Figure 2).
This is likely a measure of the casing
cement that appears to contain
significantly increased concentrations
of uranium and thorium relative to
background formation.
Density and photoelectric
factor
Wireline density and photoelectric
factor (PEF) measurements are impaired
over most of the open-hole section
because of the large, washed-out
borehole. Low density and PEF values
correspond to intervals of enlarged
borehole (Figure
2). Where the hole is near-gauge,
HLDS density is consistent with MAD core
sample measurements.
Temperature
Temperature data were acquired while
running into the hole and during the
three upward logging passes, revealing a
highly repeatable borehole fluid
temperature profile (Figure 2).
The marked gradient increase at the top
of the near-gauge interval may be
indicative of more conductive conditions
or suggests that seawater flowing into
the well isn't mixing below that depth.
A short temperature anomaly (a ~0.5°C
rise followed by a 0.2°C drop) is
observed below the casing shoe. The
gamma ray and SP curves have too much
character to offer any correlation with
the temperature anomaly, which occurs in
the 14.75 inch rathole section where the
hole is beyond the reach of the HLDS
caliper.
Ultrasonic Imaging
|
|
|
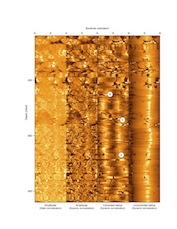
Figure
6. Selected UBI
ultrasonic images from Hole
U1362A
|
The ultrasonic borehole images are
marred by tool motion (while logging,
downhole heave displacement averaged 0.8
m with excursions greater than 1.5 m).
Post-logging processing helped mitigate
those tool motion effects but they are
still pronounced and visible as smears
and truncations (Figure 6).
Moreover, the UBI sonde head was
undersized so no images can be expected
where the hole is even moderately out of
gauge. Where the hole is near-gauge,
certain centimeter- to meter-scale
dipping sinusoidal features are
observed. The images from the third
pass, which were collected using the
highest-resolution UBI configuration,
discern an interval of pillow basalt
lying above a zone of sheet basalt at
458 mbsf.
Spontaneous Potential
The SP data from the three logging
passes repeat very well, exhibit little
noise and appear insensitive to hole
condition (Figure
2). The SP measurement was
developed for wells drilled into
sediment formations on land and in
Expedition 327 the measurement is
impaired by the absence of a proper
surface ground, by stray current at the
rig, and by the comparable salinities of
the drilling fluid and formation waters.
More work needs to be done to interpret
deepwater SP data.