Logging Summary
|
| IODP Expedition 334: |
|
Costa Rica Seismogenesis
Project 1 (CRISP-A1)
Expedition 334
Scientific Party
|
| Introduction |
|
|
|
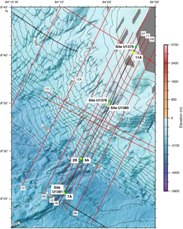
Figure 1.
Location map of CRISP program
sites, IODP Expedition 334.
|
Integrated Ocean Drilling Program
Expedition 334, the Costa Rica
Seismogenesis Project (CRISP), was
designed to understand the processes
that control nucleation and rupture of
large earthquakes at an erosional
convergent margin. The Costa Rica
location was selected because of its
relatively thin sediment cover, fast
convergence rate, abundant seismicity,
subduction erosion, and change in
subducting plate relief along strike.
CRISP drilling complements other
deep-fault drilling (San Andreas Fault
Observatory at Depth and Nankai Trough
Seismogenic Zone Experiment) and
investigates the first-order seismogenic
processes common to most faults and to
those unique to erosional margins. The
primary goals of Expedition 334 were to
characterize the lithological, physical,
and frictional properties of upper plate
material; to estimate the subduction
channel thickness and the rate of
subsidence caused by subduction erosion;
to characterize the fluid flow system
and thermal structure of the erosive
margin; and to determine the change in
the stress field across the updip limit
of the seismogenic zone.
The downhole logging program of
Expedition 334 was designed to
complement the core sample record by
measuring continuous, in situ profiles
of physical properties such as bulk
density, porosity, resistivity, and
natural gamma ray radiation. In addition
to these formation properties, downhole
logging provides oriented images of the
borehole wall useful to determine the
directions of bedding planes, fractures,
and borehole breakouts. In the
conventional technique of wireline
logging, downhole measurements are taken
by tools lowered in a previously drilled
borehole. Wireline logging has had
limited success in deep holes in
unconsolidated clastic sequences such as
those planned for Expedition 334,
because these holes tend to be unstable
after drilling. In
logging-while-drilling (LWD), downhole
measurements are taken by instrumented
drill collars in the bottom-hole
assembly (BHA) near the drill bit.
Hence, LWD measurements are made shortly
after the hole is drilled and before the
adverse effects of continued drilling or
coring operations. LWD has been
successful in previous scientific
drilling expeditions to convergent
margins (Nankai Trough, Barbados, and
Costa Rica), and was selected as the
logging technique for Expedition 334.
|
|
Logging
Operations
|
LWD operations were carried out in
Holes U1378A and U1379A (see location
map in Figure
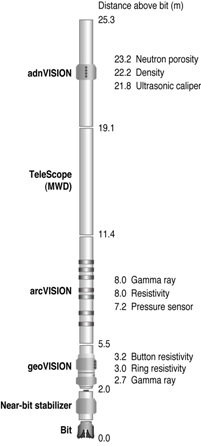
1). The Schlumberger LWD tools
used during Expedition 334 were the
geoVISION 675 (near-bit electrical
resistivity, resistivity images, natural
gamma ray), the arcVISION 675 (annular
borehole pressure, resistivity, natural
gamma ray), the adnVISION 675 (bulk
density, neutron porosity, density and
ultrasonic caliper), and the TeleScope
675 (drilling mechanics data and
real-time telemetry). All these tools
had a 6.75 inch (17.1 cm) diameter and
were located above a 8.5 inch (21.6 cm)
drill bit. Figure
2 shows the configuration of the
LWD bottom hole assembly with the depth
of the measuring sensors relative to the
bit.
LWD operations in Hole U1378A were
stopped at a total depth of 455 mbsf and
did not reach the original depth
objective because drilling could not
progress due to high standpipe and
downhole pressures, backflow when making
pipe connections, and large torques on
the top drive. Similar problems were
encountered later in coring Site U1378
and the nearby Site U1380 (drilled to
524 mbsf and 482 mbsf, respectively).
Hole U1379A was successfully drilled and
logged by LWD to a total depth of 966
mbsf, exceeding the original target
depth of 950 mbsf.
The measurements recorded by the LWD
tools were downloaded and processed
without difficulties and were of high
quality in both holes, except for the
geoVISION resistivity image data. The
orientation system of the geoVISION tool
malfunctioned in Hole U1378A and the
tool clock did not record time properly
in Hole U1379A. The geoVISION data were
sent to a Schlumberger LWD data
processing center in Houston, but
attempts to recover useful measurements
were unsuccessful. The adnVISION tool,
however, measured borehole images of
density and hole diameter and provided
valuable information on borehole
breakouts (see below).
LWD logs were acquired at the beginning
of Expedition 334 in the first hole
drilled at Sites U1378 and U1379. As
these holes were drilled without coring,
the LWD data had to be monitored to
detect gas entering the wellbore. This
LWD hydrocarbon monitoring procedure
substitutes the IODP standard of using
gas ratio measurements made on cores.
The LWD monitoring protocol used during
Expedition 334 was similar to protocols
used in previous IODP expeditions where
LWD holes were drilled before coring,
Expedition 308 (Gulf of Mexico
hydrogeology) and 311 (Cascadia margin
gas hydrates). The primary measurement
used for gas monitoring was annular
pressure while drilling (APWD), measured
downhole by the arcVISION LWD tool and
transmitted to the surface in real time.
As free gas in the borehole lowers the
borehole fluid density and decreases the
pressure, the monitoring procedure
consisted primarily in monitoring
variations of APWD over a baseline
hydrostatic pressure trend. A sustained
drop in pressure greater than a
specified threshold required stopping
drilling and circulating a full volume
of the borehole annulus while monitoring
pressure. If the pressure remained
static and equal to the hydrostatic
pressure trend, drilling could be
resumed. If the pressure was lower than
hydrostatic, the protocol required
killing the hole with weighted mud and
abandoning the hole. The specific
threshold pressure drops requiring
attention were chosen to ensure that gas
flow in the well could be killed with
weighted mud. During LWD operations in
Expedition 334, no sustained pressure
drops that exceeded the threshold set in
the monitoring protocol were observed,
and no drilling interruptions were
necessary.
Logging
Results
|
|
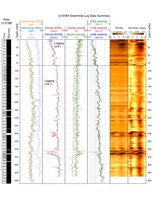
Figure 3. Summary of LWD
measurements in Hole U1378A.
|
Hole U1378A
Figure 3
shows a summary of the LWD data acquired
in Hole U1378A. The LWD measurements are
of high quality, except for anomalously
low densities measured in intervals
where the borehole was enlarged to 10-12
inch (25-30 cm). These enlarged borehole
intervals with low measured densities
are visible in the borehole radius image
of Figure 3 in the depth intervals
290-310 and 340-370 mbsf (see also the
comparison to core data below).
Two logging units were defined on the
basis of the LWD measurements. Logging
Unit 1 (0-82 mbsf) corresponds to a
compacting sequence where density and
resistivity increase and porosity
decreases with depth. The top of Logging
Unit 2 (82-455 mbsf) is marked by a step
increase in density and resistivity,
which then increase slowly with depth.
Porosity shows a matching small decrease
with depth in Logging Unit 2.
|
|
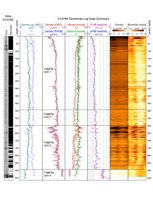
Figure 4. Summary of
LWD measurements in Hole U1379A.
|
Hole U1379A
Figure 4
shows a summary of the LWD data acquired
in Hole U1379A. The LWD measurements are
of high quality, except for anomalously
low densities measured in intervals
where the borehole was enlarged to 10-13
inch (25-33 cm). These enlarged borehole
intervals with low measured densities
are visible in the borehole radius image
of Figure 4 in the depth intervals
340-360 and 600-890 mbsf (see also the
comparison to core data below).
Four logging units were defined on the
basis of the LWD measurements. Logging
Unit 1 (0-492 mbsf) corresponds to a
compacting sequence where density and
resistivity increase and porosity
decreases with depth, reaching nearly
constant values at the base of the unit.
The top of logging Unit 2 (492-600 mbsf)
is marked by a small step increase in
density and resistivity. The
distinguishing feature of Logging Unit 3
(600-892 mbsf) is the presence of many
borehole enlargements, which are likely
to correspond to unconsolidated sand
layers or fractured intervals. Logging
Unit 4 (892-955 mbsf) corresponds to the
basement rocks of the sedimentary
sequence, and is clearly identified by a
sharp shift in the baseline of natural
gamma ray, density, and resistivity
logs. Compared to the sediments above,
the basement unit shows a marked
increase in the average density and
resistivity and a corresponding decrease
in porosity.
Scientific
Highlights
Borehole Breakouts
Borehole breakouts are sub-vertical
hole enlargements that form on opposite
sides of the borehole wall by local
failure due to non-uniform stress. In a
vertical borehole, the breakout
direction is parallel to the minimum
principal horizontal stress orientation
and perpendicular to the maximum
principal horizontal stress orientation.
Therefore, borehole breakouts are key
indicators of the state of stress in the
subsurface.
Despite their limited azimuthal
resolution (image data are sampled in 16
azimuthal sectors, i.e., every 22.5°),
the LWD borehole images acquired in
Expedition 334 clearly display borehole
breakouts as two parallel, vertical
bands of low density or large radius
180° apart. Hole U1378A shows an
interval of well-developed breakouts at
220-438 mbsf (Figure
3). The average azimuth of the
breakouts is roughly NE-SW to ENE-WSW,
indicating that the maximum horizontal
stress is oriented NW-SE to NNW-SSE.
Breakouts are evident in Hole U1379A in
the interval 292-885 mbsf (Figure 4).
In Hole U1379A, the average azimuth of
the breakouts is roughly N-S to NNW-SSE,
indicating that the maximum horizontal
stress is oriented E-W to ENE-WSW.
|
|
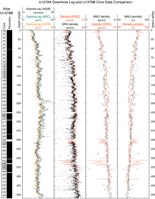
Figure 5.
Comparison of LWD log data in
Hole U1378A (colored curves) and
core measurements in Hole U1378B
|
|
|
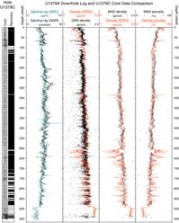
Figure
6. Comparison of LWD
log data in Hole U1379A (colored
curves) and core measurements in
Hole U1379C
|
Core-log integration: natural
gamma ray and density
Figure 5
and Figure 6
show a comparison of natural gamma ray
radioactivity, bulk density, and
porosity measured by LWD and in core
samples at Sites U1378 and U1379. This
comparison is useful to correlate depths
in the LWD logs and depths of core
samples and to integrate information
from log and core measurements.
Natural gamma ray log measurements are
calibrated to a degree API (gAPI) scale
by comparison to a standard artificial
formation built to simulate about twice
the radioactivity of a typical shale and
conventionally set to 200 gAPI. In
contrast, the natural gamma ray (NGR)
measurement made on whole core sections
on the JOIDES Resolution is in
units of counts per second. The
comparison of log and core natural gamma
ray measurements in Figure 5 and
Figure 6
shows that their curves overlap if 1
count/second equals about 2 gAPI. Most
patterns in the log and core natural
gamma ray records match closely, with
only a few depth shifts likely due to
the data being collected in different
holes and to uncertainties in the depth
measurement. The general agreement
between log and core measurements of
natural gamma ray radioactivity
indicates a close correlation in the
depths of the log and core records.
Figure 5
and Figure 6
also compare image-derived bulk density
logs (IDRO) to densities measured on
whole core sections by gamma-ray
attenuation (GRA) and on discrete core
samples by moisture and density (MAD)
analysis. The bulk density values are
generally consistent, with the exception
of several intervals where the log
densities are clearly lower than the
core densities and the corresponding
logged porosities are unrealistically
high (e.g., the interval 350-375 mbsf of
Site U1378). As noted above, these
extremely low logged values of density
are likely to be due to borehole
enlargements.
There are intervals in both sites where
the core densities are systematically
lower than the logged densities (110-200
mbsf at Site U1378 and 110-500 mbsf at
Site U1379). The differences are 3-11%
of the overall bulk density value. A
contributing factor to this difference
may be core expansion by elastic
rebound, as many cores in these depth
intervals showed more than 100%
recovery. The MAD porosities are density
porosities calculated from the measured
bulk and grain densities in each core
sample. As the MAD densities in these
intervals are slightly lower than the
log densities, the MAD porosities are
slightly higher than the porosities
computed from the density log.
Summary
Logging-while-drilling of Holes U1378A
and U1379A of IODP Expedition 334
measured profiles of natural gamma-ray
radioactivity, density, neutron
porosity, and electrical resistivity
together with images of the borehole
wall. While technical difficulties
prevented us from acquiring resistivity
images, the LWD tools successfully
collected 360-degree coverage images of
bulk density and borehole radius. The
borehole radius images show clear
evidence of borehole breakouts, which
form when there are differences in the
principal horizontal stresses. Analysis
of this unique borehole image data set
will provide estimates of the state of
stress in the subsurface of the Costa
Rica convergent erosive margin.
|
Alberto Malinverno:
Logging Staff Scientist, Borehole
Research Group Lamont-Doherty Earth
Observatory of Columbia University, PO
Box 1000, 61 Route 9W, Palisades, NY
10964, USA
Saneatsu Saito:
Logging Scientist, Institute for
Frontier Research on Earth Evolution
(IFREE), Japan Agency for Marine-Earth
Science and Technology (JAMSTEC), 2-15
Natsushima-cho, Yokosuka 237-0061 Japan
|
|
|