IODP
Expedition 303: North Atlantic Climate
1
Figure
6
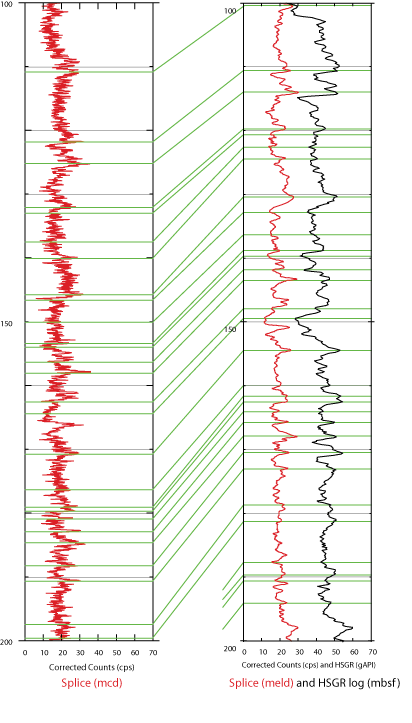
Correlation of spliced core gamma-radiation data (corrected counts) in red with logging data in black, for the depth interval of 100 to 200 m from Site U1305. In the left-hand panel is the spliced data in mcd; the right hand panel shows the corrected spliced data (in meters equivalent logging depth or meld) and the logging data (mbsf). Note that spliced core record in the right-hand panel has been smoothed in Sagan to allow easier correlation. cps = counts per second; gAPI = American Petroleum Institute gamma ray units.
