IODP
Expedition 309/312: Superfast Spreading
Rate Crust 2 and Superfast Spreading Rate Crust 3
Figure
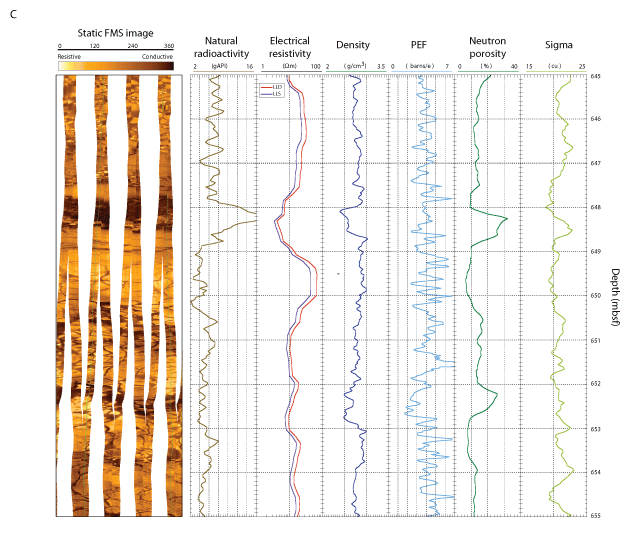
5c
Figure 5: Formation MicroScanner (FMS) resistivity images (static normalization) of depth intervals 345 - 355 mbsf, 470 - 480 mbsf, and 645 - 655 mbsf recorded during Expedition 309. Natural radioactivity, electrical resistivity (LLD: LateroLog Deep, LLS: LateroLog Shallow), density, photoelectric effect (PEFL), neutron porosity and capture cross-section (sigma) are reported on the right columns. (C) Massive unit displaying a marked increase of the natural radioactivity at 648 mbsf.
