IODP
Expedition 311: Cascadia Margin Gas Hydrates
Figure
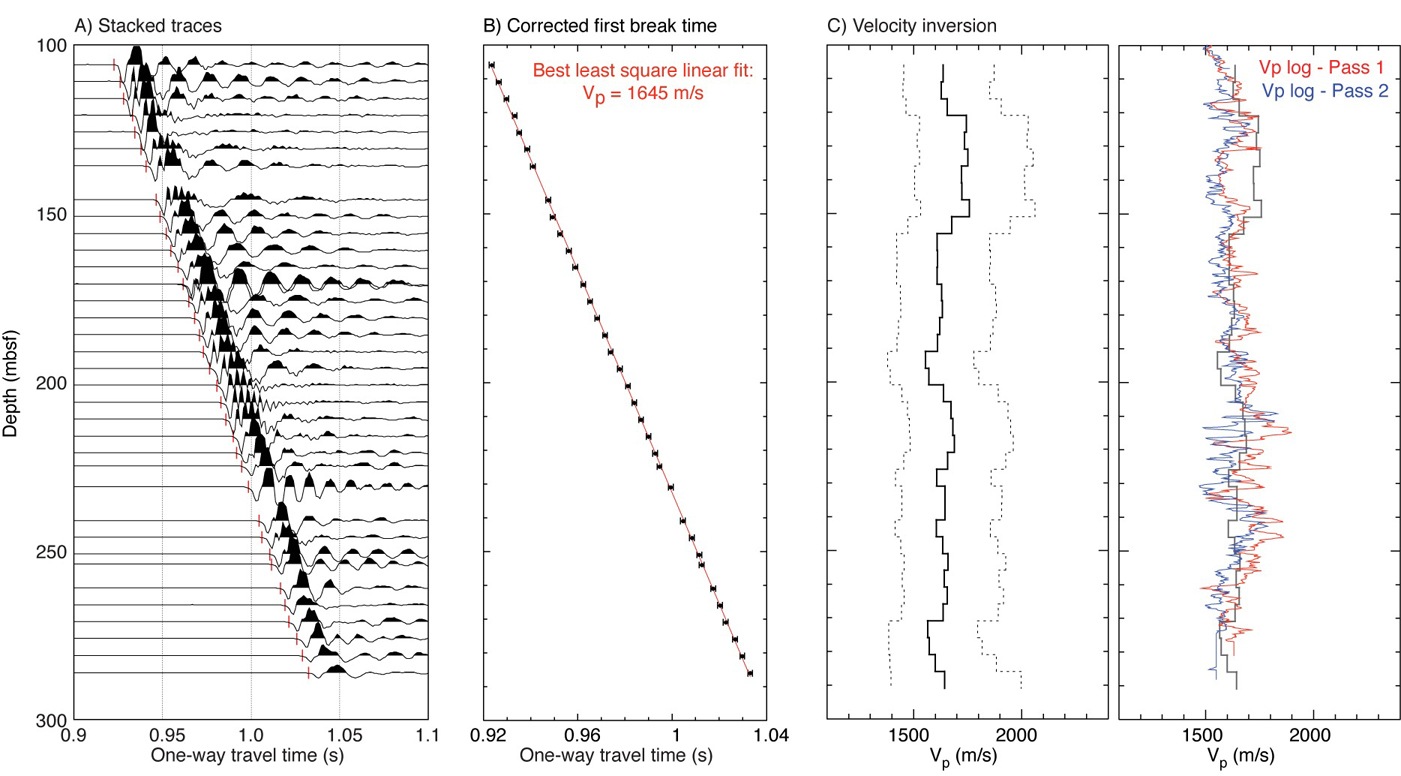
10, 10b, and 10c
VSP
results in Hole U1328C. A) Stacked
traces with original automated picks. B) Corrected
picks. The red line indicates the least square linear fit for
the entire data set. C) Comparison
of the Bayesian inversion results with the two passes of the
sonic log recorded in the same hole.