IODP
Expedition 320-321: Pacific Equatorial Age Transect
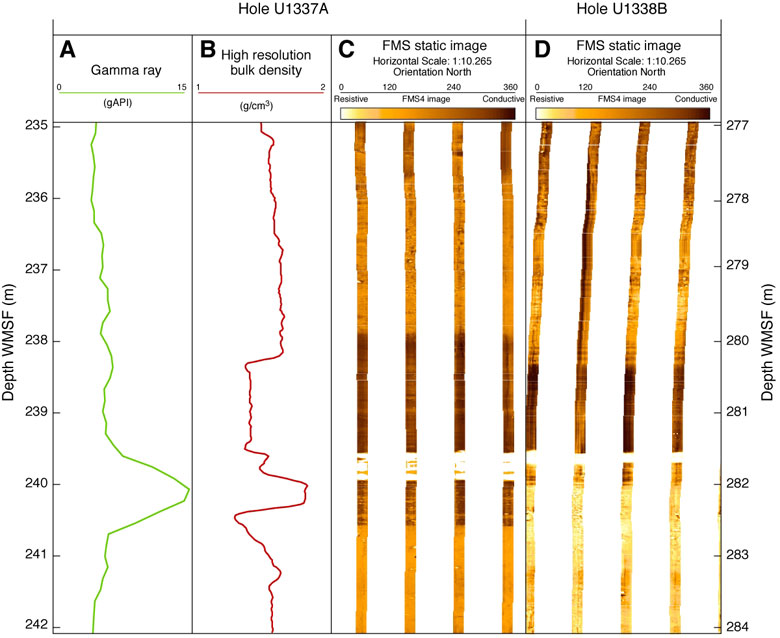
Figure
9
Downhole logs in the interval containing a thin chert layer, Holes U1337A and U1338B. A and B: Natural gamma-ray radioactivity and high resolution bulk density log, respectively, in Hole U1337A. C and D: Formation MicroScanner (FMS) resistivity images in Holes U1337A and U1338B, respectively. The depth scale on the left is for Hole U1337A (logs in A, B, and C) and the depth scale on the right is for Hole U1337B (logs in D). Light shades in the images are high resistivities, dark shades low resistivities.