IODP
Expedition 336: Mid-Atlantic Ridge Microbiology |
Figure
7 |
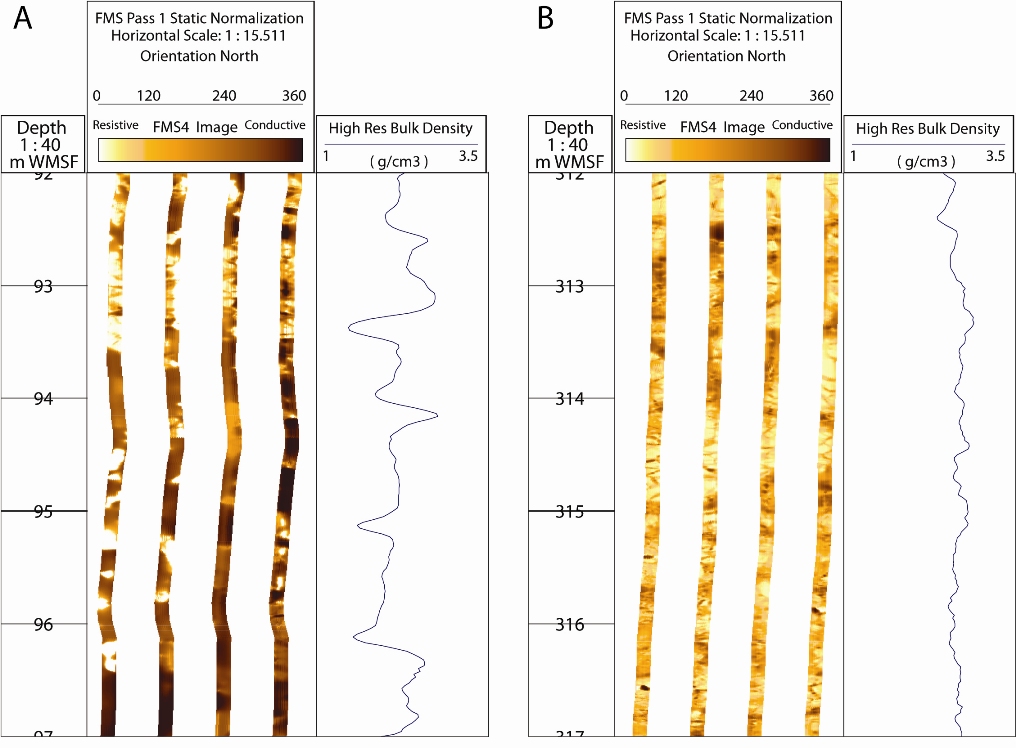
Composite of features imaged by the Formation MicroScanner (FMS), Hole U1383C. Note that images here are shown from Pass 1 of the FMS-sonic tool string. A. Boundary between log Units I and II, moving from more a resistive to more conductive region. B. Zone of typical pillow lavas visible in log Unit IV. A high-resolution bulk density curve (in blue) is shown to the right of each FMS image for information. |