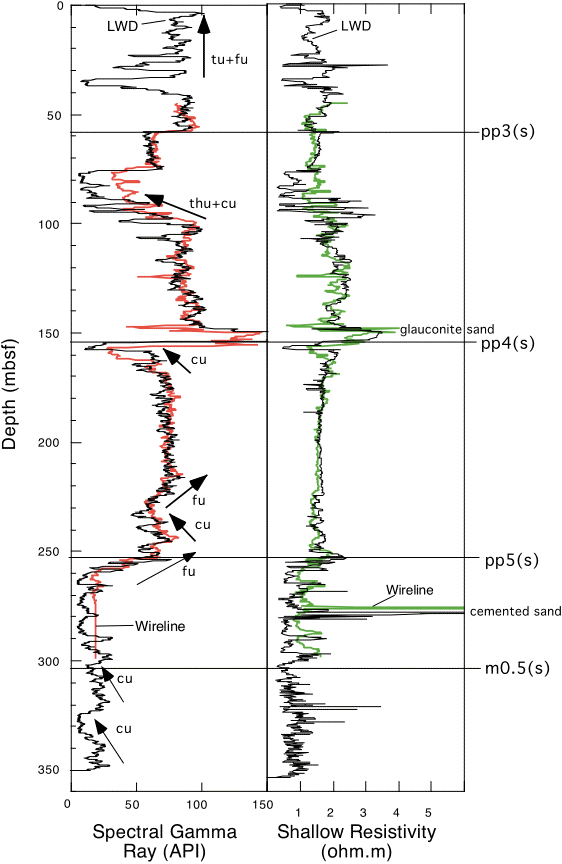

Small vertical mismatches between the logs, particularly across surface pp4(s), are associated with local variability in bedding and small scale topography at this sequence boundary (holes are about 30 m apart). Differences in resistivity between the LWD and wireline runs occur primarily in the unconsolidated sand-rich intervals and is interpreted to result from borehole fluid invasion in these intervals (wireline measurements were made several hours after drilling compared to a few minutes for the LWD resistivity).
Major bedding trends derived from the gamma-ray and resistivity logs and are indicated as: fu=fining-upward, cu=coarsening-upward, tu=thinning-upward, thu=thicknening-upward.