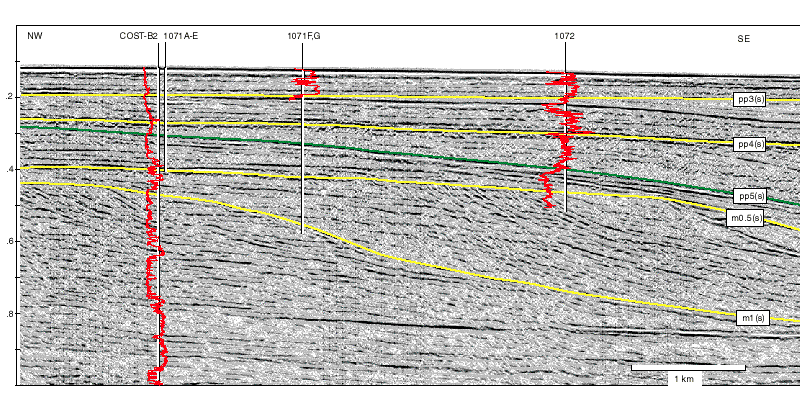

Yellow surfaces are seismic sequence boundaries and the green surface (pp5[s]) is a prominent flooding surface. LWD gamma-ray logs are displayed as a function of travel time in red, together with the COST-B2 gamma-ray log (a portion of it, above m0.5, was acquired through casing). Lines marking the position of Sites 1071 and 1072 extend to the maximum depth cored.