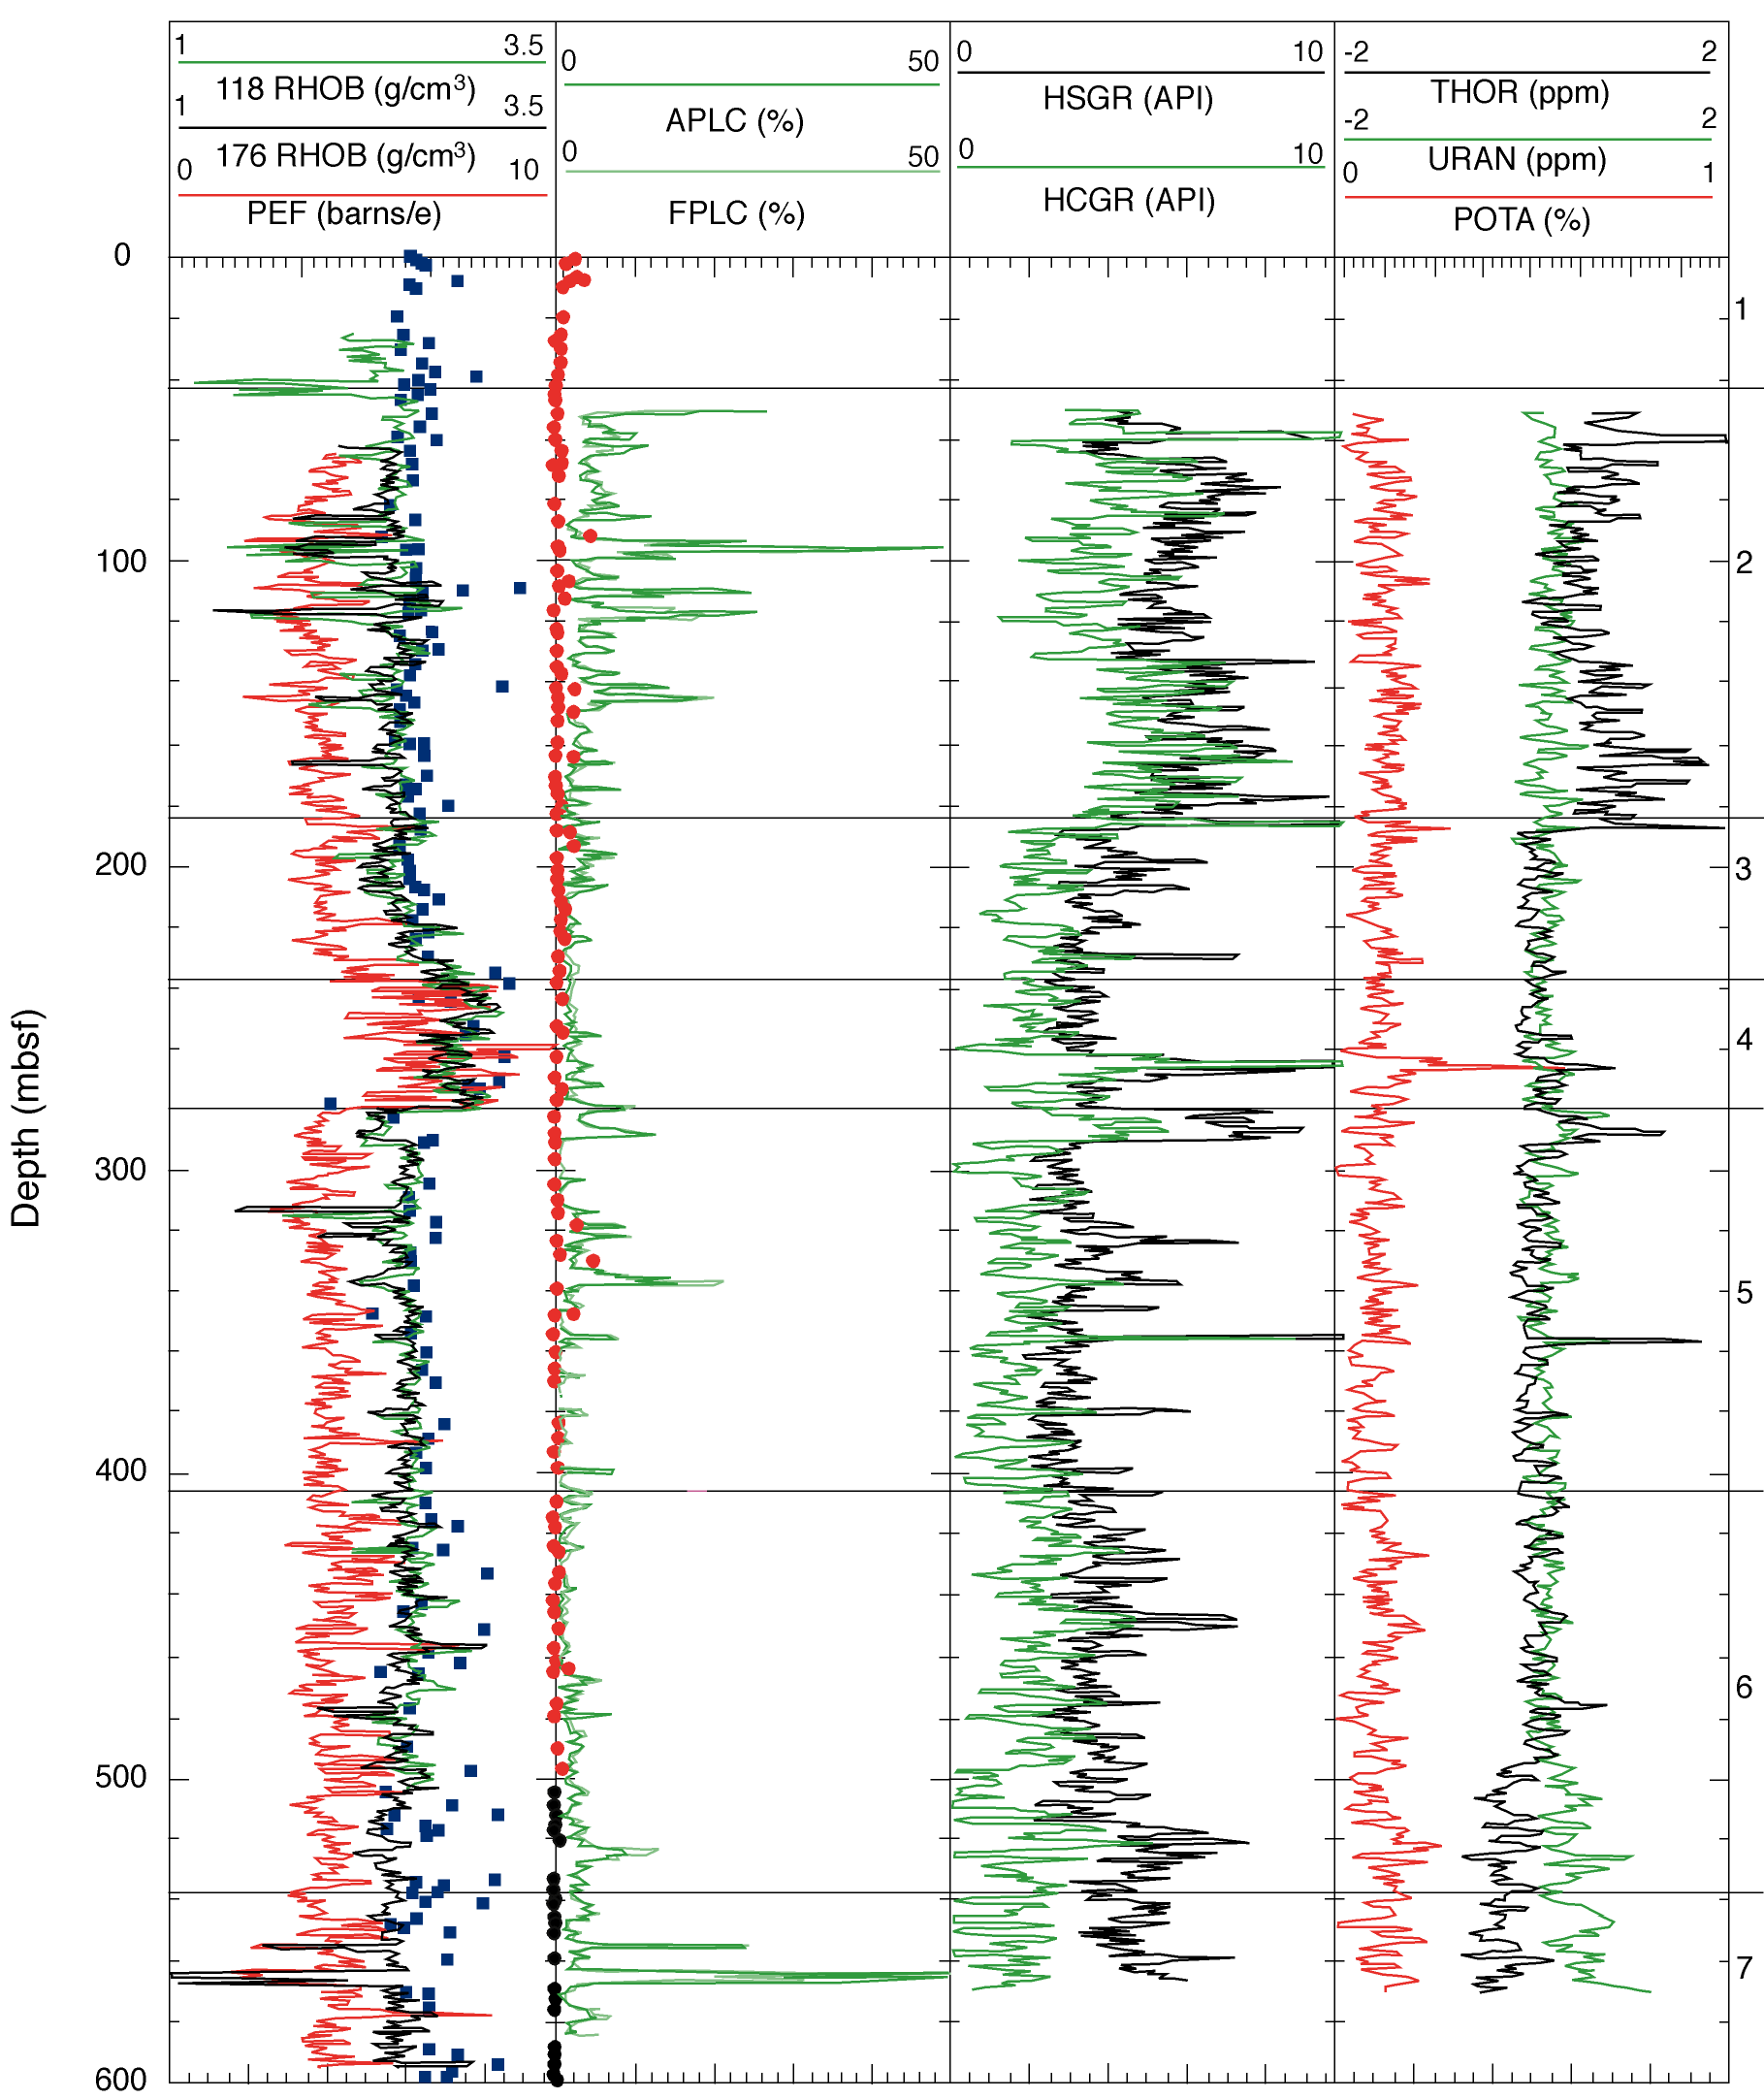

Plots showing the Leg 118 density (118 RHOB), Leg 176 density (176 RHOB), Legs 118 and 176 discrete laboratory measurements and photoelectric effect (PEF) in track 1; array epithermal porosity (APLC), Far/Near detector porosity (FPLC) and Legs 118 and 176 discrete laboratory porosity measurements in track 2; spectral gamma-ray (HSGR) and computed gamma-ray (HCGR) in track 3; and thorium (THOR), uranium (URAN) and potassium (POTA) in track 4. The bottom scale in the plot axis shows the scale increments for the bottom-most curves displayed above the plot and the top scale shows the increments for the top-most curves shown above the plot.