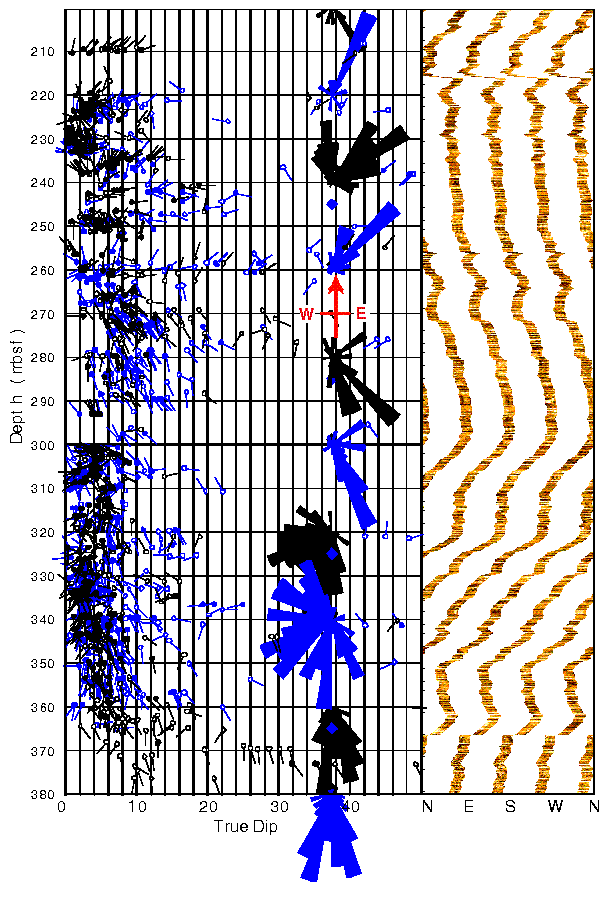
Figure 9: Structural analysis of the FMS images in Hole 1149B. The analysis of pass 1 is in black and pass 2 in blue. The down-dip azimuths and the dip values of individual beddings/features are indicated by the direction of the tadpoles tails and by the position in the grid. Hollow tadpoles indicate lower confidence in the quality of the correlation. The fanplots give the distribution of the dip azimuth over 20-m intervals. They indicate a possible structural or tectonic change at ~ 290 mbsf, between Units III and IV, where the general orientation of beddings changes from North East in Unit III to South/South-West in Unit IV.
