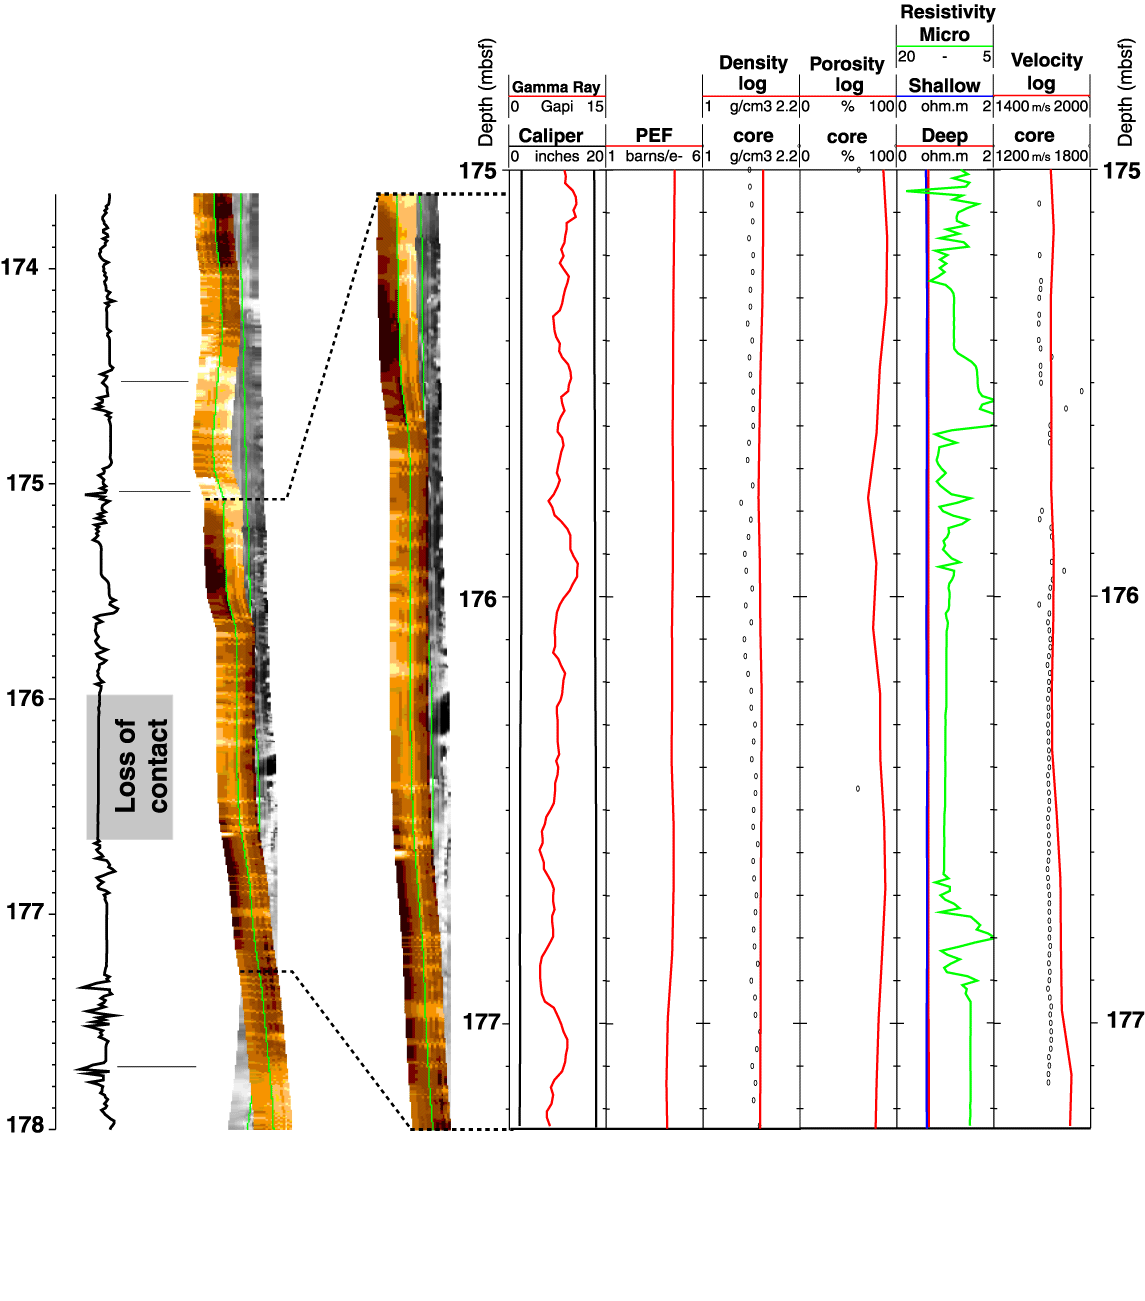
FMS (single button micro-resistivity plot and dynamic normalized image), geophysical and geochemical log data for a section in Log Unit 1 (Hole 1218A). The high-resolution gamma ray log identifies 0.5-1 m cyclicity, while the higher resolution FMS image data also identifies the higher frequency cycles.
